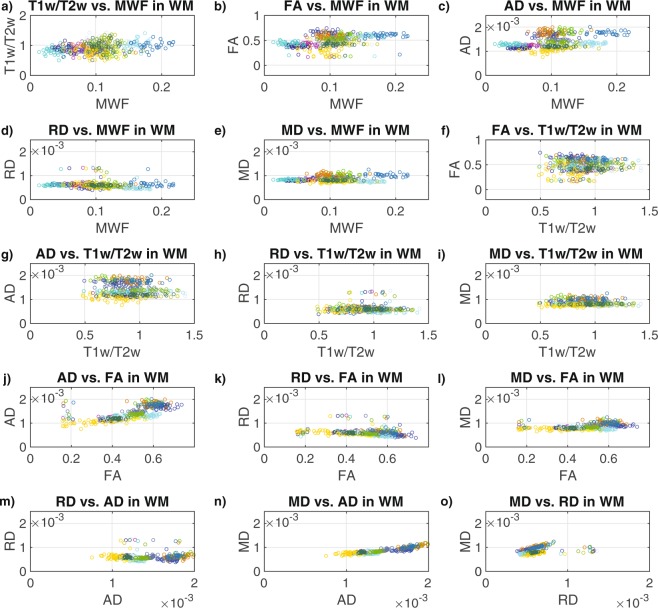
Figure 5.
Scatter plots between the MRI measures across the 15 bilateral white matter ROIs: (a) T1w/T2w vs. MWF in WM (b) FA vs. MWF in WM, (c) AD vs. MWF in WM, (d) RD vs. MWF in WM, (e) MD vs. MWF in WM, (f) FA vs. T1w/T2w in WM, (g) AD vs. Tw/T2w in WM, (h) RD vs. Tw/T2w in WM, (i) MD vs. Tw/T2w in WM, (j) AD vs. FA in WM, (k) RD vs. FA in WM, (l) MD vs. FA in WM, (m) RD vs. AD in WM, (n) MD vs. AD in WM, and (o) MD vs. RD in WM. Each structure is indicated by a different color in order to match the ROIs shown in Fig. 1, and the values for each participant are represented by individual dots.

