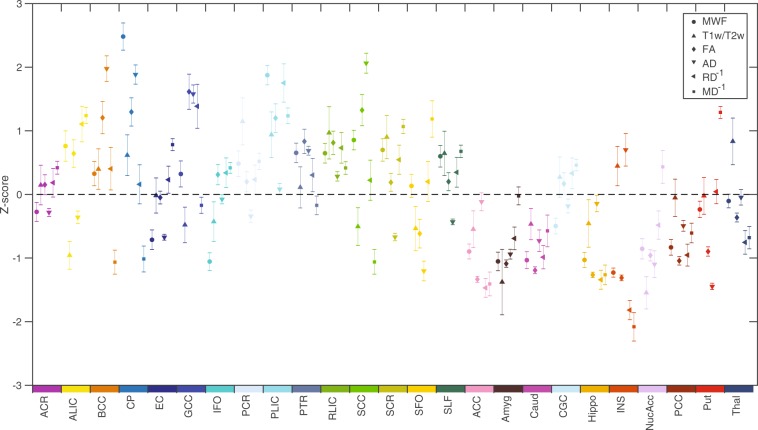
Figure 7.
Standardized z-scores (mean ± 99% confidence interval) computed across the brain are shown for each measure (MWF, T1w/T2w, FA, AD, RD−1 and MD−1) in each of the 25 ROIs. Each structure is indicated by a different color in order to match the ROIs shown in Fig. 1, and values for RD and MD were inverted (RD−1 and MD−1) prior to z-scoring, in order to produce analogous contrasts (i.e., positive z-scores reflecting greater microstructural integrity and negative z-scores reflecting lower microstructural integrity) across measures.

