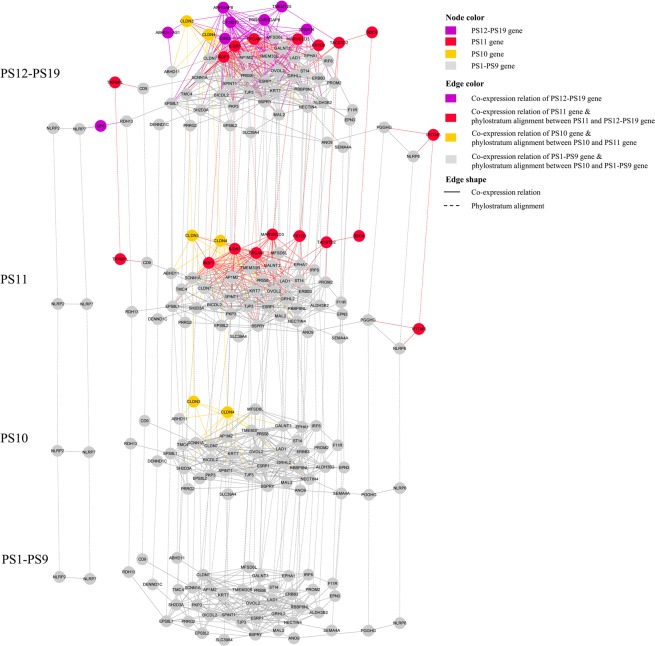
Figure 3.
The phylostratigraphic alignment of co-expression relations’ constrictions in four periods: PS1–PS9, PS10, PS11 and PS12–PS19. Nodes in this module in different phylostratigraphic time-points represent genes, while edges depict two kinds of relations: the co-expressed relations between any two nodes inner one period and phylostratum alignment between genes from diverse phylogenetic time-ponits. Node colors depict gene’s origin time (phylostratigraphic time-points). Edge colors depict gene’s co-expression or phylostratigraphic alignment relation emergence time-points. Edge shapes depict genes’ relation type, the solid line indicate co-expression relation and long dash line means phylostratum alignment.

