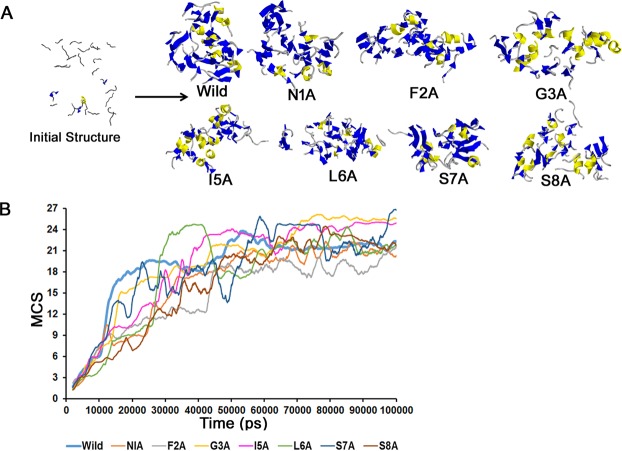
Figure 1.
Oligomer formation in wild type and the ala-scanned peptides. (A) Snapshot of the initial (1 ns) and later stages (Wild (90.11 ns), N1A (99.30 ns), F2A (79.26 ns), G3A (86.98 ns), I5A (90.63 ns), L6A (88.62 ns), S7A (87.25 ns) and S8A (81.22 ns) peptide clusters- clusters are shown by ribbon models where coil, helices, and sheets are shown in ‘grey’, ‘yellow’ and ‘blue’, respectively) configuration. The ‘initial structure’ shows wild type snapshot at 1 ns which was similar for all the mutants. Initially, 27 peptides were aligned parallelly inside a cubic box [(104 Ǻ)3] with approximately 30,000 water molecules which form oligomers during the simulation. These structures were rendered using Rastop (Valadon P., www.geneinfinity.org/rastop/). (B) Time dependence of the mean cluster size (MCS). MCS is plotted against time for all the eight systems. Large clusters were observed for all the analogs by the end of the simulation.

