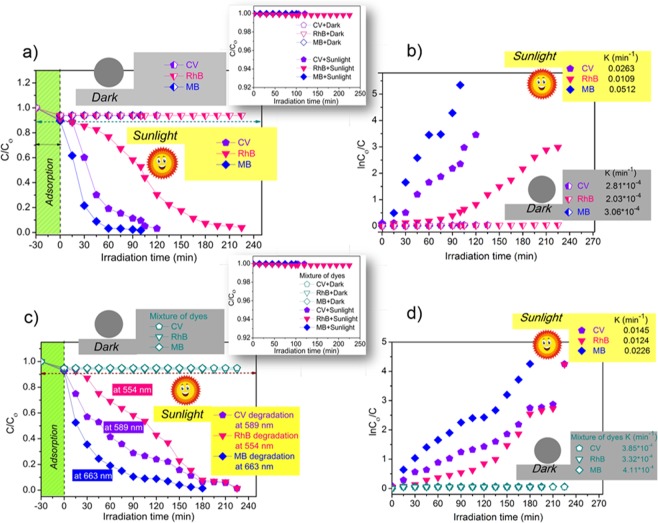
Figure 3.
(a) Extent of plot of (C/Cο) for the individual dyes (CV, RhB and MB) with wsGNS in dark and sunlight (with inset showing photocatalytic degradation of the respective dyes in the absence of wsGNS); with their (b) respective plot of ln(Cο/C); (c) Extent of plot of (C/Cο) (with inset showing photocatalytic degradation of the mixture of dyes in the absence of wsGNS) of a mixture of dyes with wsGNS in dark and sunlight; with their (d) respective plot of ln(Cο/C).

