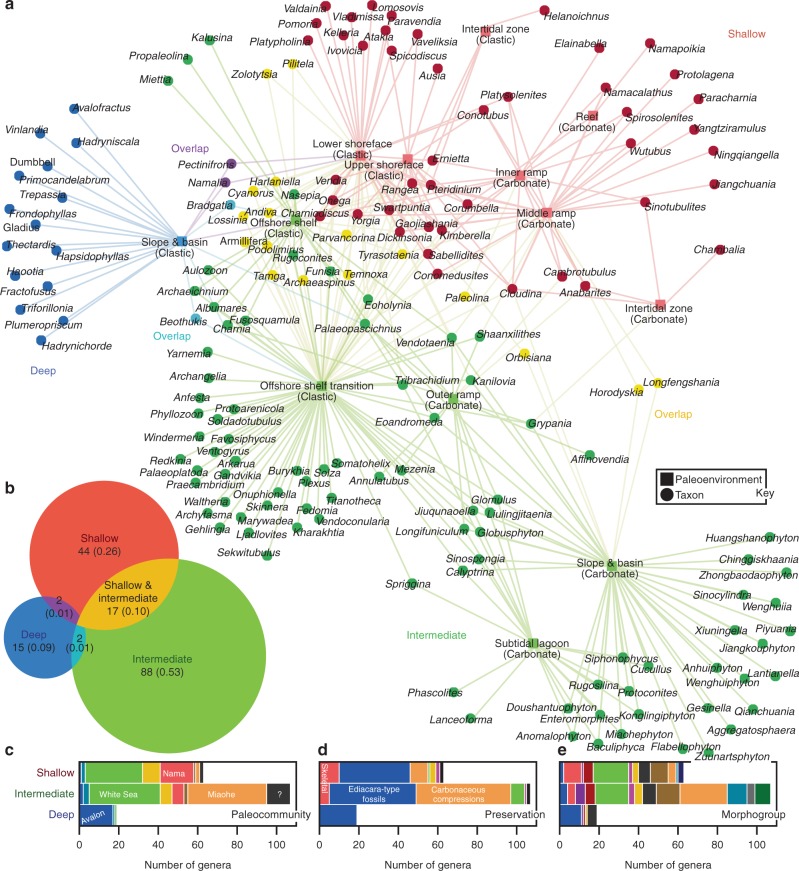
Fig. 3.
Bipartite network of paleoenvironments and Ediacaran macrofossil genera. a Network graph. A genus and paleoenvironment are linked if fossils of the taxon have been reported from matching facies (Supplementary Table 4). Colors indicate modules identified using the COPRA community-detection algorithm (v = 2). According to randomization testing, this community structure is statistically significant (Supplementary Fig. 9, paleoenvironments projection, Q = 0.39, P = 0.05, Z = 1.46; taxa projection, Q = 0.51, P = 0.05, Z = 1.27). All paleoenvironments and genera fall into three modules—the deep (blue), shallow (red), and intermediate (green) clusters—named for the relative water depths of their centroids along a model shallow-to-deep-water transect. b Venn diagram illustrating taxonomic overlap of modules. Areas of circles correspond to their relative numbers of genera, numbers are counts of taxa, and values in parentheses are proportions. c Stacked bar graph showing numbers of genera belonging to the various Ediacaran paleocommunities in each module (colors are those used in Fig. 2a, b). d, e Stacked bar graphs showing numbers of genera in the modules and their preservational modes (d) and morphogroups (e). See Fig. 2 for color keys and Supplementary Fig. 10 for related analyses. Source data are provided as a Source Data file

