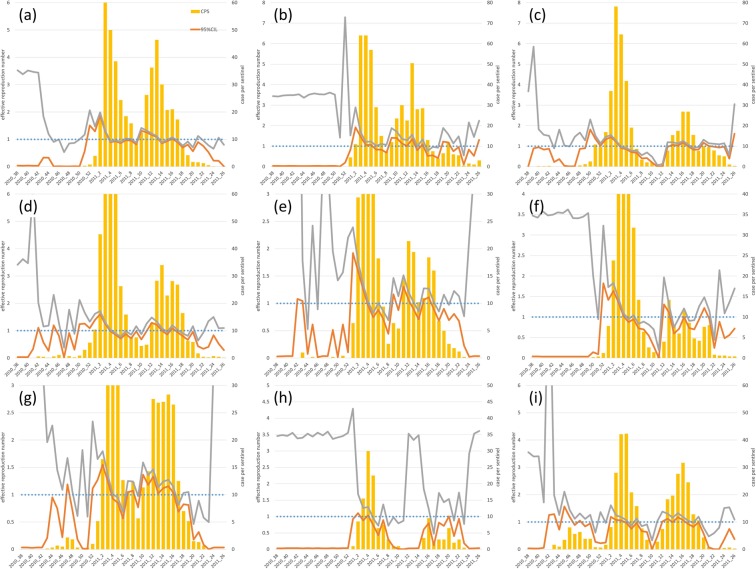
Figure 2.
Observed epidemic cases and effective reproduction number. The weekly number of reported cases per sentinel (bar plot), the lower 95% credible interval limit of the effective reproduction number (Rt) (95% CIL) (orange line), the upper 95% credible interval limit of Rt (95% CIU) (grey line) and the threshold both for Rt (1.0) and pre-epidemic warning (10.0) are shown in blue dotted line. The situations in Miyazaki city, Chuo, Miyakonojo, Nobeoka, Nichinan, Kobayashi, Takanabe, Takachiho, and Hyuga are shown in (a–i), respectively.

