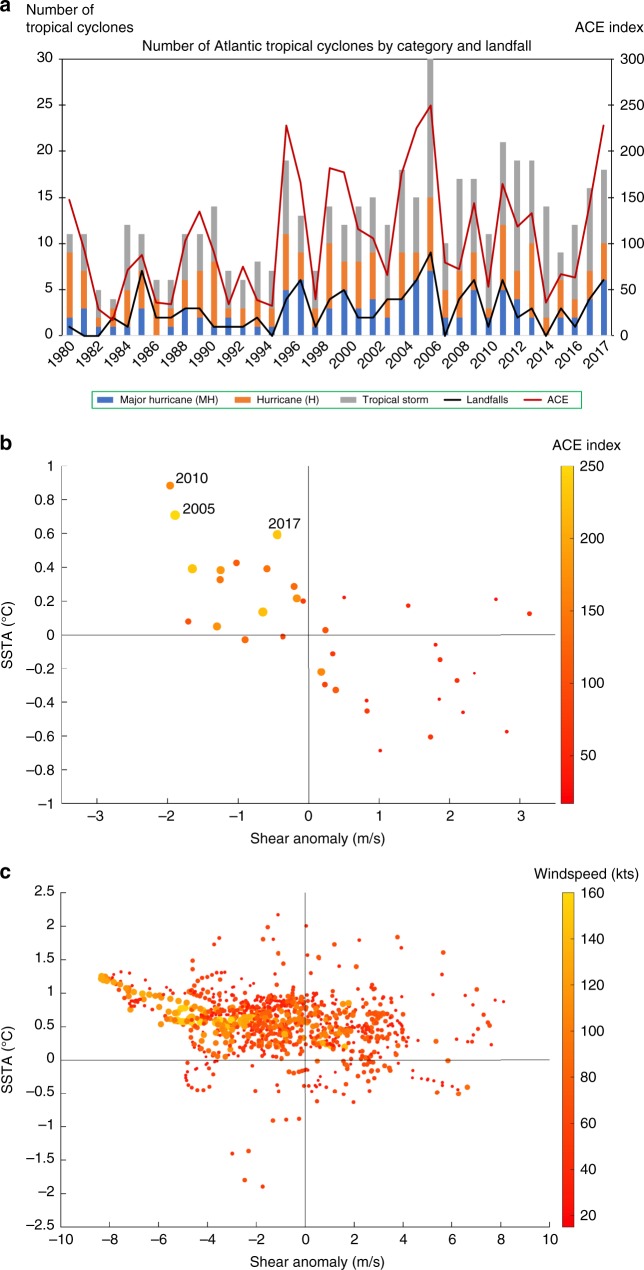
Fig. 1.
Atlantic tropical cyclone analysis. a Observed Atlantic tropical cyclone activity and ACE index from 1980–2017. b SSTA and vertical wind shear anomalies in the MDR between July and September for the period 1980–2017 and associated ACE Index (point size and colourbar). c Six hourly data from August to September Atlantic tropical cyclone tracks for the years 2005, 2010 and 2017, detailing the SSTA (°C), vertical shear anomaly, and associated wind speed (point size and colourbar)

