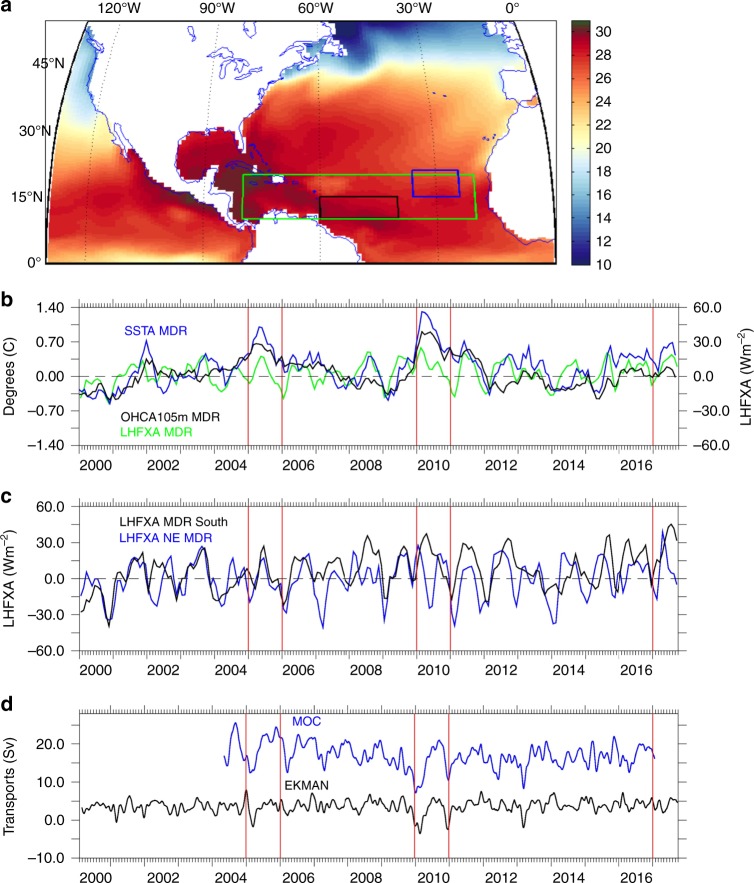
Fig. 3.
Atlantic time series and map outlining the study region. a SST September 2017: green box: MDR region 10–20°N and 20–80°W, black box: southern MDR region 10–15°N and 40–60°W, blue box: north-eastern (NE) MDR 15–21°N, 24–36°W. b–d Observed Atlantic time series: b monthly SSTA, OHCA105m and LHFXA in the MDR; c monthly latent heat flux anomalies (LHFXA) in the southern MDR and NE MDR smoothed over 3 months; and d MOC and Ekman Transports 12-hourly data smoothed over 61 days by applying a low pass filter

