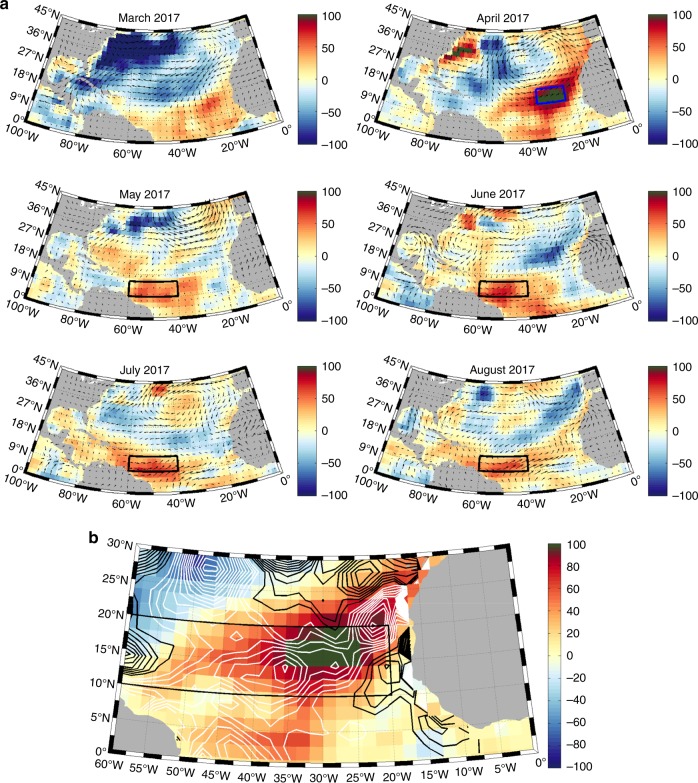
Fig. 4.
Atlantic Surface Heat Flux Anomalies (the sum of the net shortwave, net longwave, latent and sensible heat fluxes) during the build-up and early stages of the 2017 hurricane season. a Observed monthly surface heat flux anomaly from March to August 2017 (Wm−2) overlaid with the 1000 mb wind anomaly, red colours indicate stronger heat gain than normal. Blue box indicates the eastern Atlantic region. Black box indicates the southern MDR region. b Observed Atlantic surface heat flux anomaly in April 2017 (Wm–2) overlaid with the wind stress curl anomaly (WSCA). White contours indicate a negative WSCA (anomalous downwelling), grey contours indicate a positive or zero WSCA (anomalous upwelling). Contour units are 10−8 Nm−3

