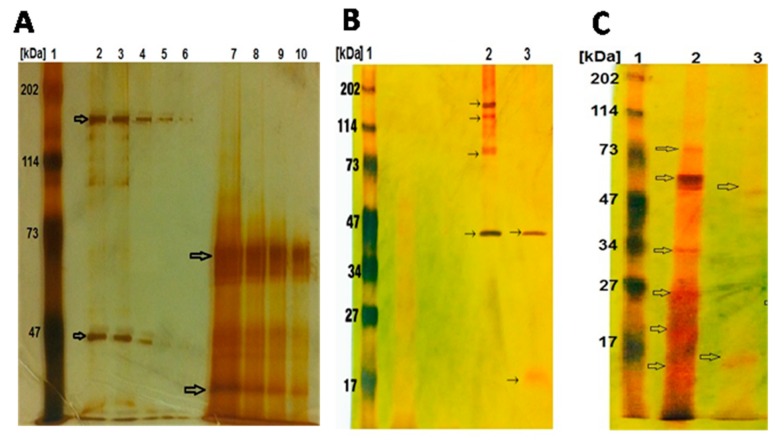
Figure 4.
SDS-PAGE analysis of solubilized native and activated Bt parasporal crystal inclusions. PS proteins was resolved onto 12% SDS-PAGE gel and the bands were detected by silver staining, which was performed as detailed in the methods section. (A) Protein profiles of nascent PS proteins from Bt5 and Bt7. Lanes 2–6 were loaded with PS proteins from Bt5 at 10 µg (2&3), 3.6 µg (4), 1.6 µg (5) and 0.4 µg (6); major bands at 155 kDa and 41 kDa, and light bands at 140 kDa, 114 kDa and 105 kDa. PS proteins from Bt7 were loaded into lanes 7–10 at 10 µg (7), 3.6 µg (8), 1.6 µg (9) and 0.4 µg (10); major bands at 68 kDa, 62 kDa and 30 kDa, light bands at 43 kDa, 39 kDa and 37 kDa. (B) Protein profiles of nascent and activated PS proteins from Bt5. Lane 1, molecular marker; lane 2, loaded with 10 µg native un-activated PS proteins with major bands at 155 kDa, 140 kDa, 82 kDa and 41 kDa; lane 3, trypsinized PS proteins with major bands at 41 kDa and 16 kDa. A trypsin-resistant band at molecular size of 41 kDa is evident. (C) Protein profiles of nascent and activated PS proteins from Bt7. Lane 2, loaded with 9 µg native un-activated PS proteins with major band at 68 kDa, and light bands at 83 kDa, 64 kDa, 32 kDa, 25 kDa, 19 kDa and 15 kDa; lane 3, loaded with 9 µg trypsinized PS proteins with light bands at 56 kDa and 16 kDa.

