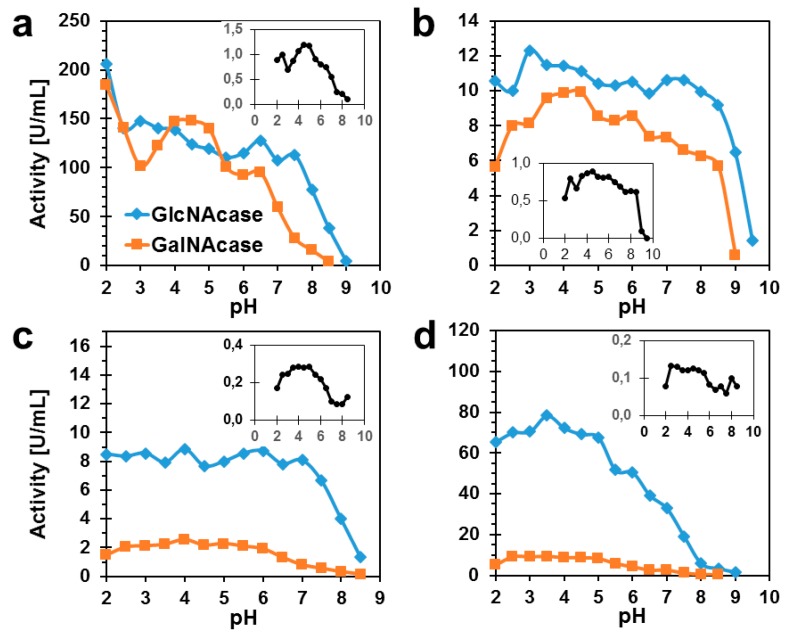
Figure 1.
The profiles of pH optima of TfHex enzyme variants. (a) WT TfHex, (b) Tyr470Phe TfHex, (c) Tyr470His TfHex, (d) Tyr470Asn TfHex. The insets show the ratio of GalNAcase/GlcNAcase activities of the respective enzyme variant (Y-axis) in relation to pH (X-axis). All data were measured in triplicate.

