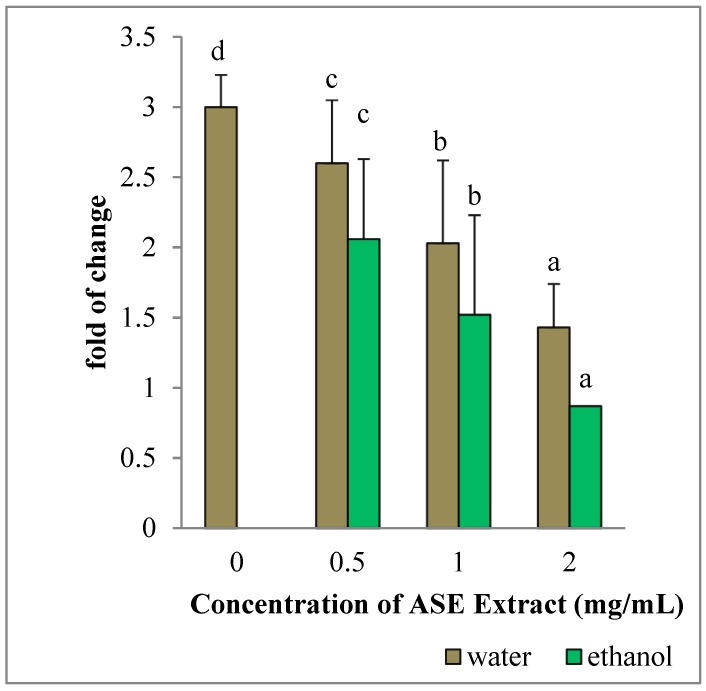
Figure 7.
Effect of ASE crude extracts on Bcl-2 gene expression in MCF-7 cells. The mRNA levels are expressed as fold of change (2−∆∆Ct) as compared to untreated HepG2 cells (defined as 1) (mean ± SD; n = 6) and normalized to GAPDH. Bars marked by unlike letters within a group are significantly different at p < 0.05, according to Duncan’s Multiple Range Test (DMRT).

