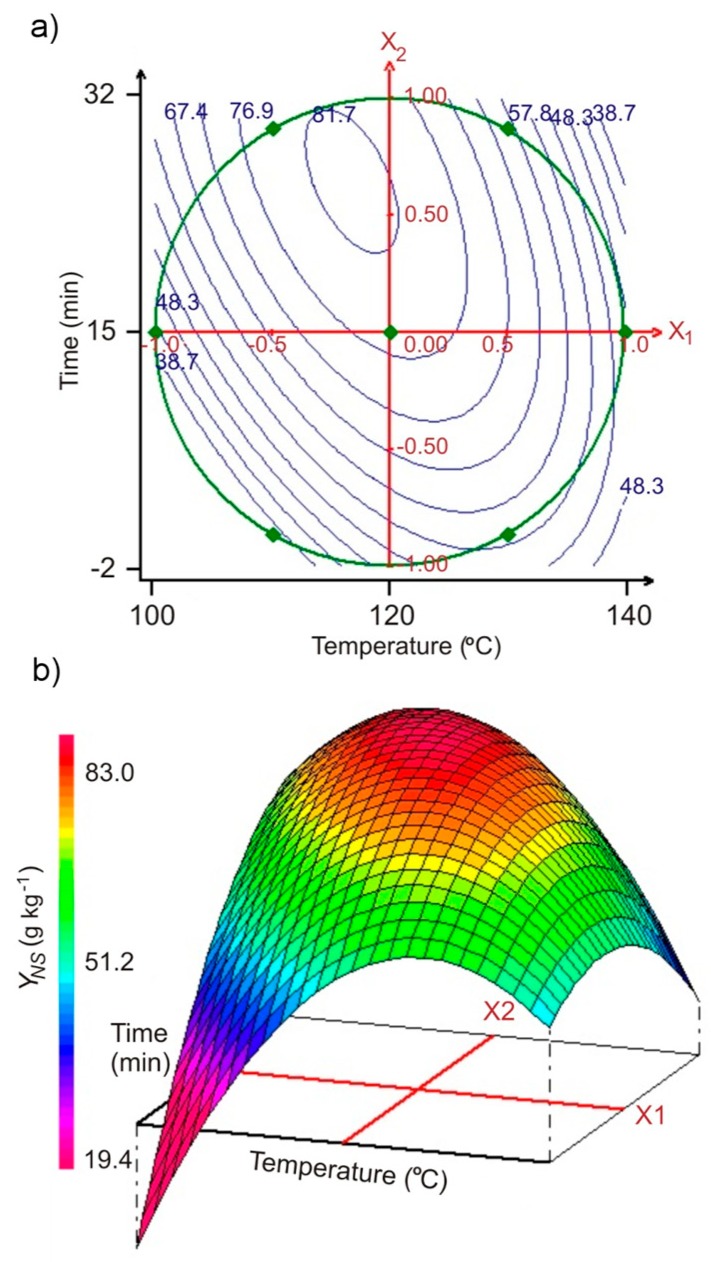
Figure 3.
(a) Contour plots of the sum of neutral monosaccharides yield YNS versus hydrolysis temperature and time of SBP hydrothermal treatment (representations based on the quadratic polynomial model, Equation (2); results obtained from Doehlert matrix, Table 2); (b) corresponding three-dimensional plot.

