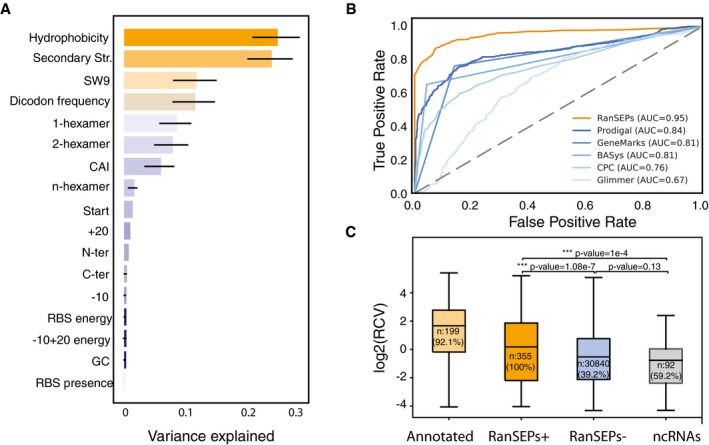
Figure 3. RanSEPs predictions.

- Feature weight prediction in M. pneumoniae. Weights of the different features considered in the classification by RanSEPs. Bars indicate the global averaged variance that each feature explains by itself along with its associated standard deviation (black line) (25 iterations to estimate the error).
- Method accuracy comparative. Receiver operating characteristic curve for RanSEPs (orange) and five additional tools (blue gradient). The closer a curve to the left‐hand border, the more accurate the tool. The area under the curve (AUC) associated with each method is presented, with values closer to 1 indicating a more accurate method. The dashed gray line represents a classifier that assigns the coding class randomly.
- Boxplot representing the relationship between RanSEPs‐positive (“RanSEPs+”, score ≥ 0.5) and RanSEPs‐negative (“RanSEPs−”, score < 0.5) SEPs predictions and associated RCV (ribosome profiling ratio coverage, in log2) in Escherichia coli. Only annotations ≤ 300 nucleotides in length were included. As positive and negative controls, we considered annotated SEPs (“Annotated”) and non‐coding RNAs (“ncRNAs”), respectively. Annotations within RanSEPs+, RanSEPs−, and ncRNAs overlapping with known annotated genes were excluded. Annotations with RCV = 0.0 are filtered out, and the number within the box represents the percentage of values in that class that are kept in the comparative. Along the top, P‐values computed by Mann–Whitney rank test are indicated.
