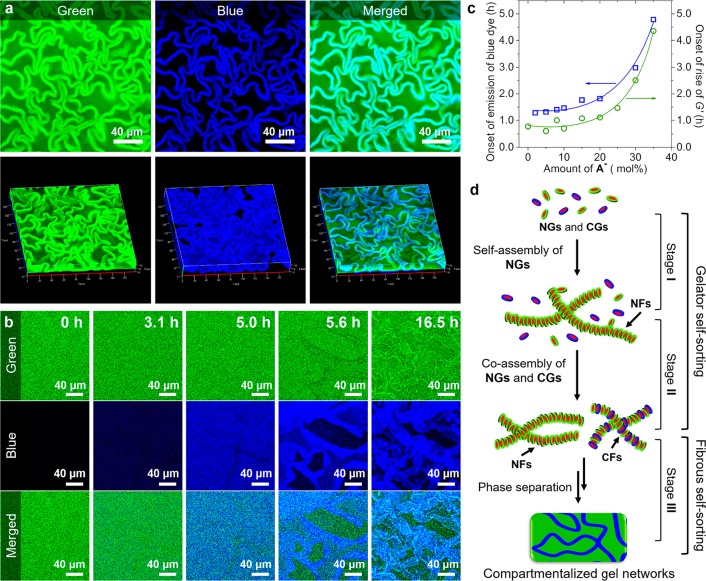
Figure 4.
(a) Split 2D (top) and the corresponding 3D (bottom) CLSM images. (b) Formation process of the gel networks (30 mol % A–). (c) Critical formation time of fibers as a function of mol % A–. (d) Illustration of the multilevel self-sorting process. 30 μM A-FL and 20 μM Hoechst 33342 were added for CLSM tests.

