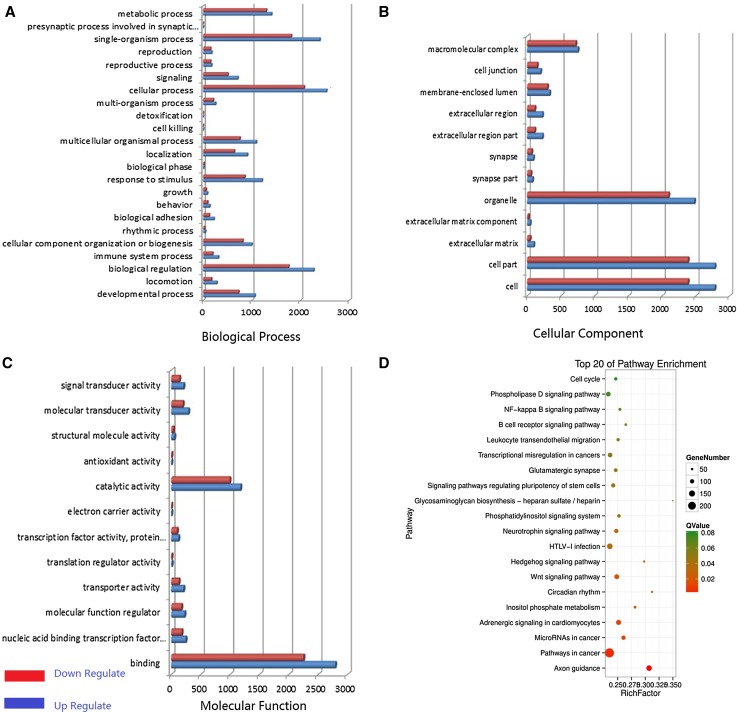
Fig. 4.
Differential expression analysis of pituitary tissues from HG and IG using high-throughput technology. a–c Differentially expressed gene distributions of gene ontology (GO) categories (level 2) of HG and IG mixed pools in goats. GO functional annotations are summarized into three main categories: biological process, cellular component, and molecular function. x-axis in panel a–c is the number of gene. d Top 20 enriched pathways of coding genes differentially expressed between HG and IG

