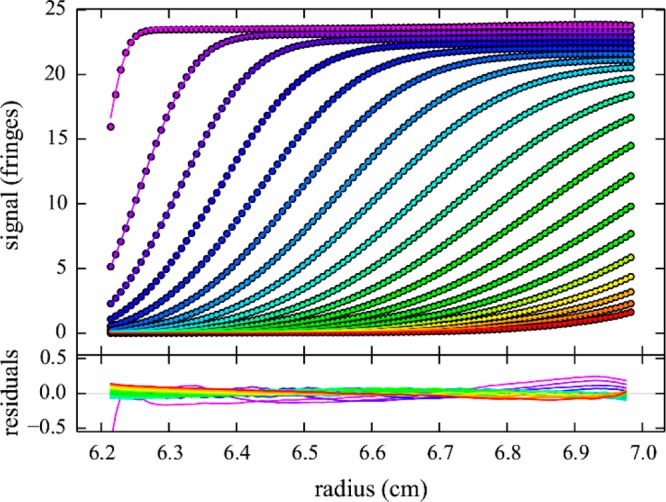
Figure 3.

Rayleigh interference optical sedimentation boundaries of 29 mg/mL HEL in 10 mM sodium acetate, pH 4.6, 300 mM NaCl at 50 000 rpm (circles) and best-fit from the cNI(s0) model (lines), as shown in Figure 4. Residuals are shown in the lower panel. The root-mean-square deviation is 0.002-fold the loading signal. For clarity only every 10th data point of every 3rd scan is shown, in a color temperature indicating the evolution of time.
