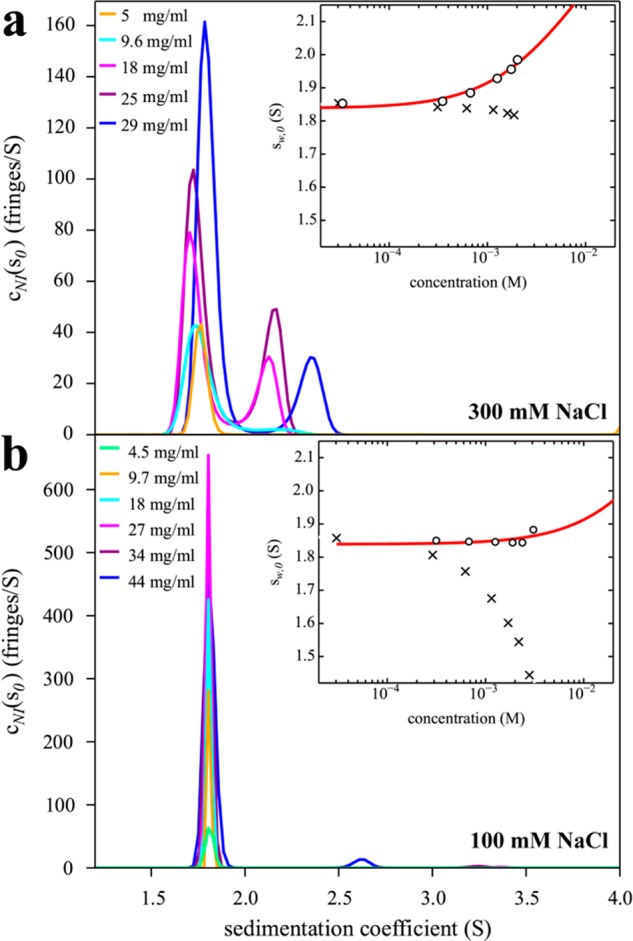
Figure 4.

Sedimentation coefficient distributions of HEL in high salt (a) and low salt (b) conditions promoting or suppressing self-association, respectively. Buffer conditions are 10 mM sodium acetate, pH 4.6, with 300 mM NaCl (a) or 100 mM NaCl (b) with HEL concentrations indicated in the legend. The insets show weight-average s-values sw as a function of concentration (corrected to standard conditions) from integration of the cNI(s0) distributions (circles) and best-fit isotherms for a monomer–dimer self-association model (red line). For (a), the best-fit KD is 24 (11–32) mM, with kS = 3.4 mL/g, whereas for (b) the best-fit KD is 260 mM, but only a lower limit KD > 53 mM can be deduced from the data, and kS = 5.7 mL/g. For comparison, conventional analyses not accounting for non-ideality lead to sw-values dominated by repulsive hydrodynamic interactions (crosses), implying apparent non-ideality coefficients for sedimentation kS* = 0.71 mL/g (a) and 6.9 mL/g (b).
