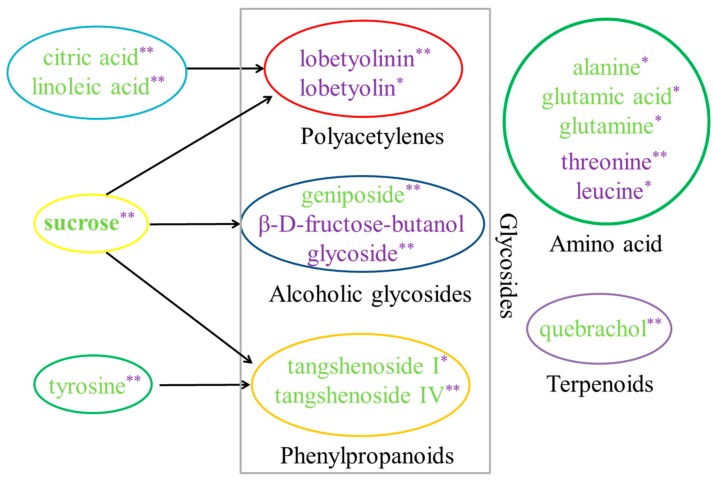
Figure 8.
Biomarkers identified in the MeJA treated adventitious root of C. pilosula. The differential analysis of the compound level was analyzed using the t-test. Purple font indicated up regulation. Green font indicated down regulation. Black arrow indicated the relationship between the precursor and metabolite. Aqua circle, fatty acid; Red circle, polyacetylenes; Green circle, amino acids; Blue circle, glycosides; Yellow circle, carbohydrates; Orange circle, phenylpropanoids; Purple circle, terpenoids. * indicated p < 0.05. ** indicated p < 0.01.

