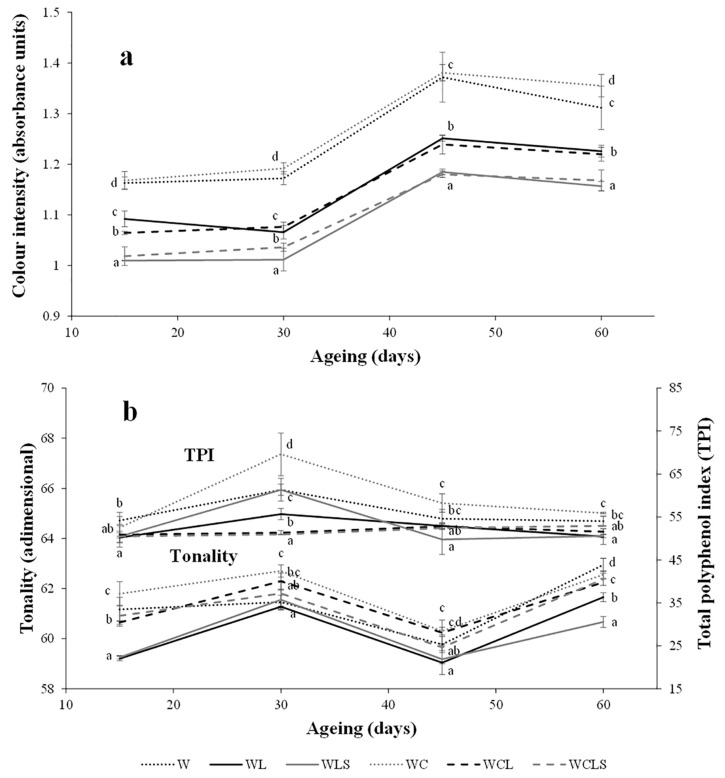
Figure 3.
Evolution of color intensity (a), and tonality and total polyphenol index (b), during the ageing on lees. W—control wine; WL—wine with lees; WLS—wine with sonicated lees; WC—wine with oak chips; WCL—wine with lees and oak chips; WCLS—wine with sonicated lees and oak chips. Mean ± standard deviation of three replicates. Different letters in axes X indicate values with statistical significant differences (p < 0.05).

