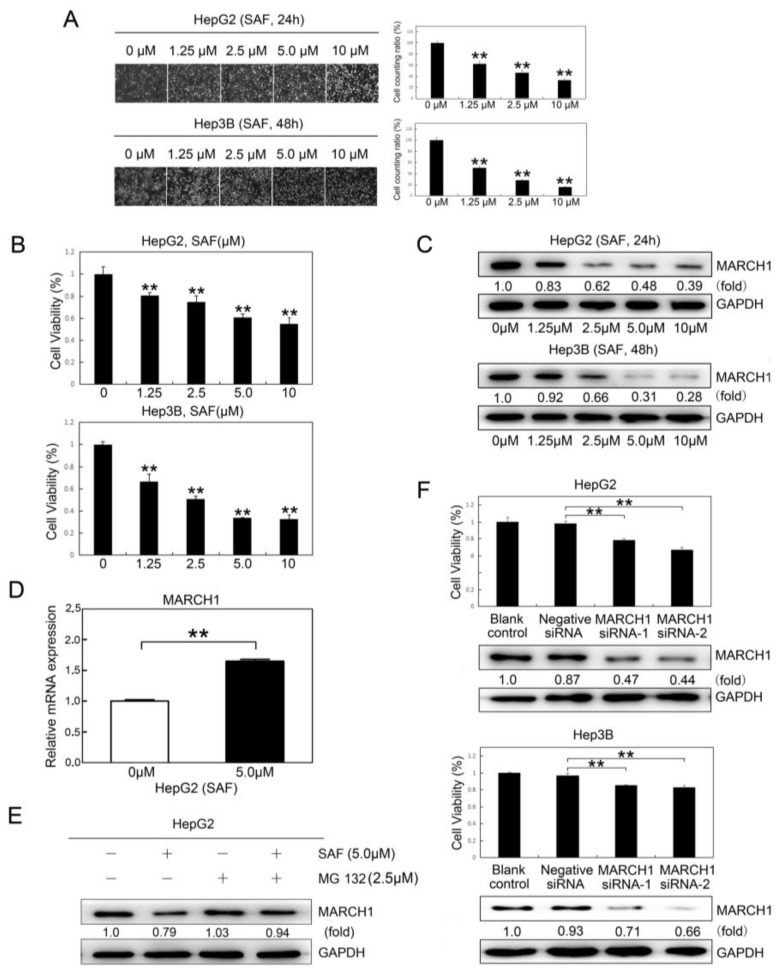
Figure 1.
Effect of SAF on HCC cell proliferation. (A) Representative images of human HepG2 and Hep3B HCC cells treated with 0, 1.25, 2.5, 5.0, and 10 μM SAF for 24 h and 48 h, respectively. (B) Cell viability assay of SAF-treated HepG2 and Hep3B cells for 24 h and 48 h, respectively (0, 1.25, 2.5, 5.0, and 10 μM). The cell growth ratio was determined relative to the untreated control (0 μΜ). (C) The expression of the MARCH1 response to SAF in HepG2 and Hep3B cells for 24 h and 48 h was determined by western blotting. (D) The MARCH1 mRNA expressions in HepG2 cells with 0, 5,0 μΜ SAF were measured directly by qRT-PCR, GAPDH as an internal control. (E) The HepG2 cells were pretreated for 5 h MG 132 which is a proteasome inhibitor. Then, the MARCH1 protein expressions in HepG2 cells treated with 0 μΜ, 5,0 μΜ SAF, and 2.5 μΜ MG 132 were measured by immunoblotting, GAPDH was used as an internal control. (F) CCK-8 assays of transfected and nontransfected MARCH1 siRNA of HepG2 and Hep3B cells for 48 h, negative siRNA as control. The knockdown of MARCH1 protein was confirmed by western blot. All data in this figure are presented as means ± SD of three independent experiments. ** p < 0.01.

