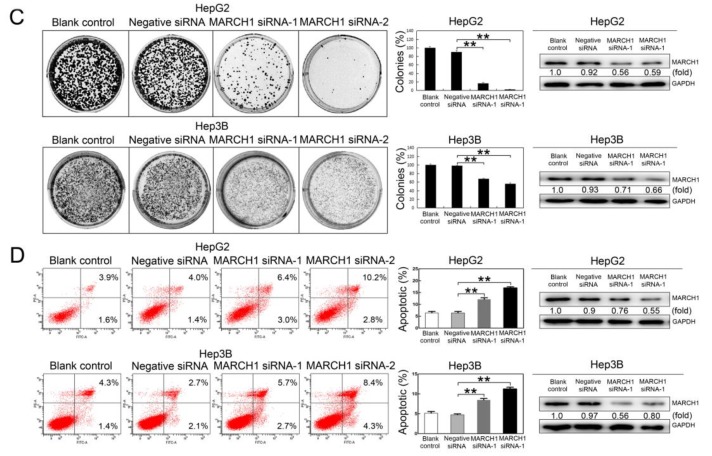
Figure 2.
Effect of SAF on HCC cell apoptosis. (A) Colonies were stained with crystal violet solution as described in the Materials and Methods. Colony formation analysis of HepG2 and Hep3B cells treated with 0, 1.25, 2.5, and 5.0 μM SAF for 24 h and 48 h, 0 μM as control. (B) Flow cytometric analysis of apoptosis in HepG2 and Hep3B cells treated with 0, 1.25, 2.5, and 5.0 μM SAF for 24 h and 48 h. The quantification of apoptotic cells was determined, 0 μM as control. (C) Colony formation analysis of HepG2 and Hep3B cells treated with two sets of MARCH1 siRNA, negative siRNA, and non transfected for 48 h, negative siRNA as control. Western blotting was used to confirm the MARCH1 siRNA knockdown in HepG2 and Hep3B cells. (D) Flow cytometry showed the apoptosis rate of HepG2 and Hep3B cells treated with MARCH1 siRNA, negative siRNA, and nontransfected for 48 h, negative siRNA as control. Western blotting was used to confirm the MARCH1 silencing efficiency in HepG2 and Hep3B cells. All data in this figure are presented as means ± SD. ** p < 0.01, * p < 0.05. These data represent three independent experiments.


