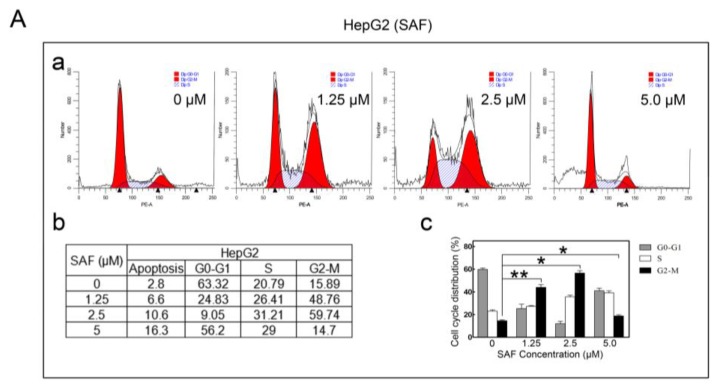
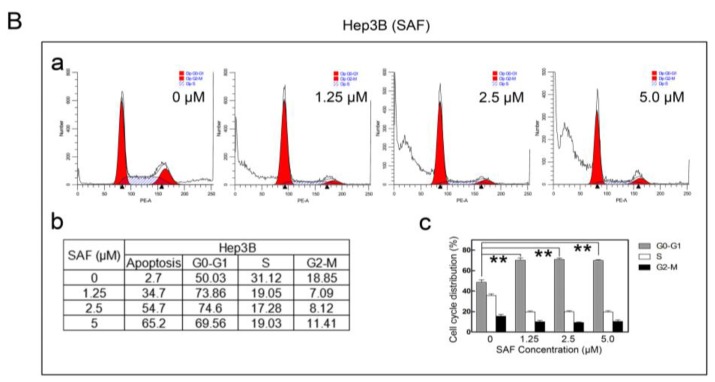
Figure 4.
Effect of SAF on the cell cycle. (A) Cells were stained with propidium iodide as described in the Materials and Methods and detected by flow cytometry. Cell cycle distribution of SAF-treated or untreated HepG2 cells for 24 h. (B) Cell cycle distribution in SAF-treated or untreated Hep3B cells for 48 h. All experiments were carried out in triplicate. The data in this figure are presented as the means ± SD. 0 μM as control, ** p < 0.01, * p < 0.05.


