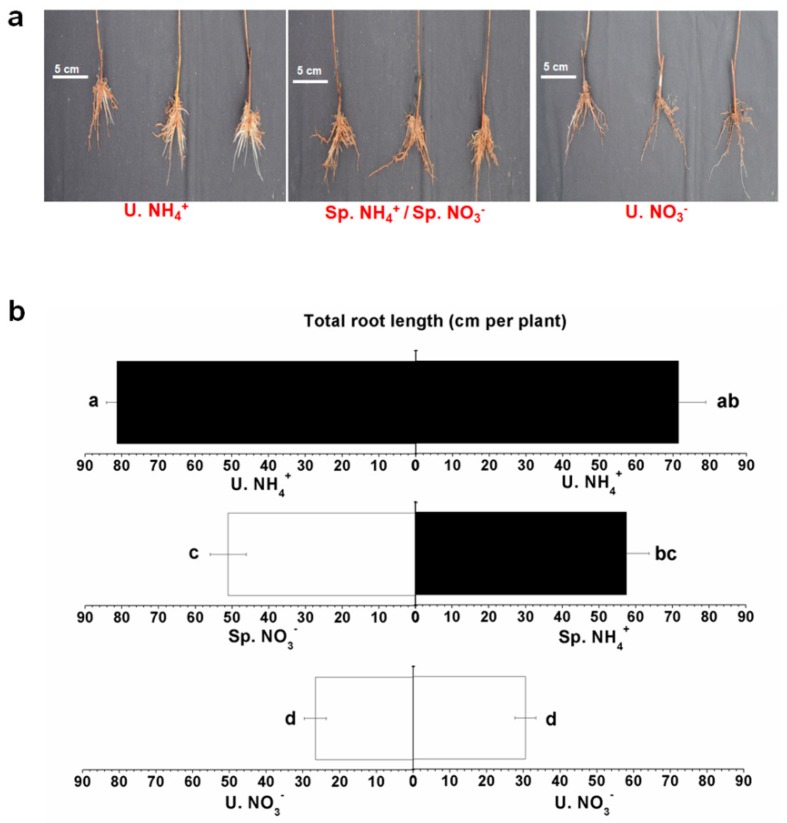
Figure 3.
Root developments under the spatial heterogeneity of different N forms. (a) The root phenotypes of different treatments and (b) the total root length of different treatments. The mean ± SE (n = 3) are shown in the data. The different letters show that means are significantly different at p < 0.05. The different conditions to compare the analytical results obtained are shown in the Materials and Methods section.

