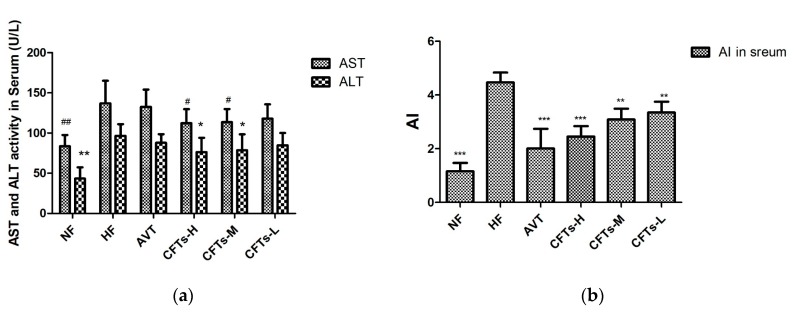
Figure 3.
Serum aminotransferase and arteriosclerosis levels. (a) AST and ALT index in serum; (b) AI index in serum. The data are presented as the means ± SD (n = 10). (*,#) Significant difference at p < 0.05, (**,##) significance difference at p < 0.01 and (###) significance difference at p < 0.001 VS the HF group.

