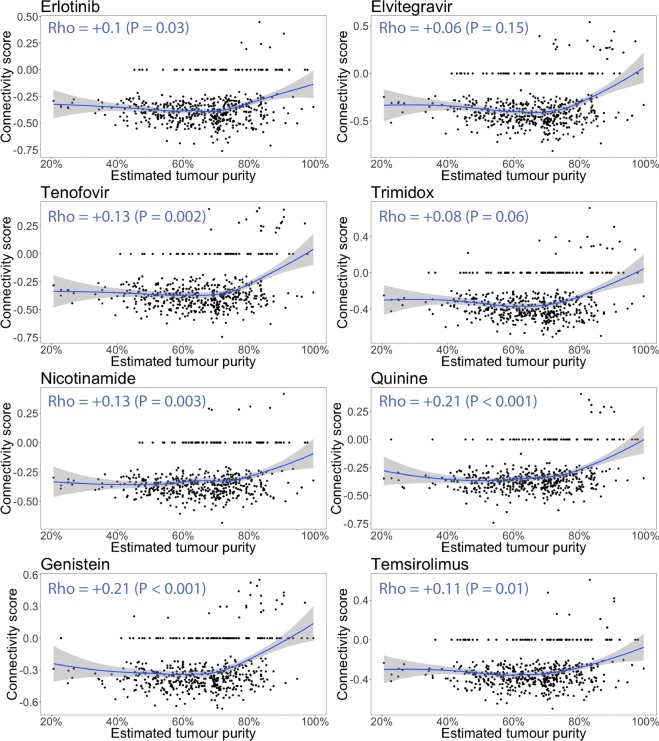
Figure 2.
Connectivity scores of the top 8 drugs from previous analysis plotted against the estimated tumour purity. The blue line is a LOESS smoother. The Spearman rank correlation coefficients and P-values are displayed in the top left of each plot. With increasing estimated tumour purity, the connectivity scores start trending towards neutral (i.e. it suggests the drugs are expected to target the genes expressed by the non-cancerous cells present at lower tumour purity). When the correlation is tested using normal (i.e. Pearson) linear regression, or the samples <80% estimated tumour purity are compared to the samples >80% estimated tumour purity using the Wilcoxon rank-sum test, all resulting P values are below 0.001 (Supplementary Table S3).

