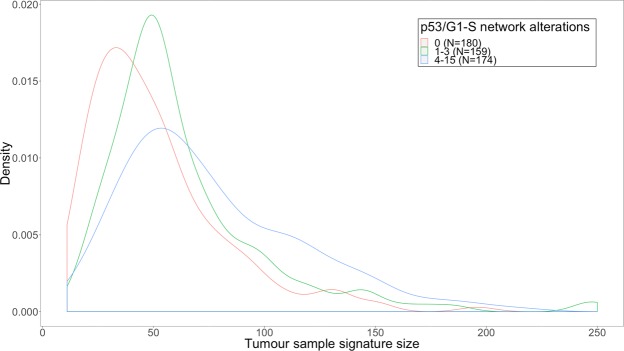
Figure 6.
Density plot of the number of overlapping genes between tumour sample signatures and LINCS drug signatures, for the 3 tertiles of the number of genes chromosomally altered in genes that regulate p53 and the G1/S cell cycle transition. The number of genes increases from 0 alterations to 1–3 alterations (P = 9 × 10⁻⁵), from 1–3 alterations to 4–15 alterations (P = 6 × 10⁻⁴) and from 0 alterations to 4–15 alterations is even more significant (P = 1 × 10⁻¹¹, all tested using the Wilcoxon rank-sum test).

