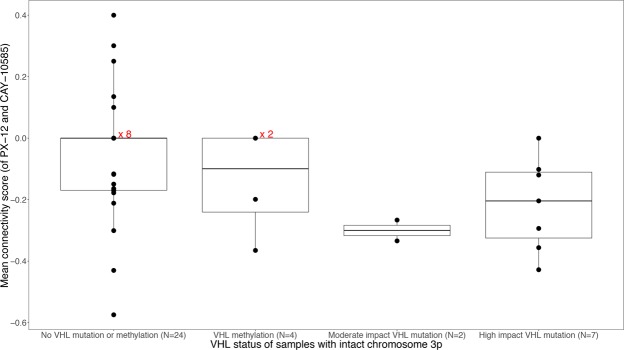
Figure 7.
Mean connectivity score of PX-12 and CAY-10585 plotted against VHL status for the 37 samples which have not lost chromosome 3p and for which both mutation and methylation data is available. Sometimes points with connectivity score 0 are plotted over each other and given the number of samples to the right (i.e. x 2, x 8). VHL mutated or methylated samples (when the 3 types are grouped together) have statistically significantly lower connectivity scores than non-VHL mutated/methylated samples (P = 0.03, Wilcoxon rank-sum test).

