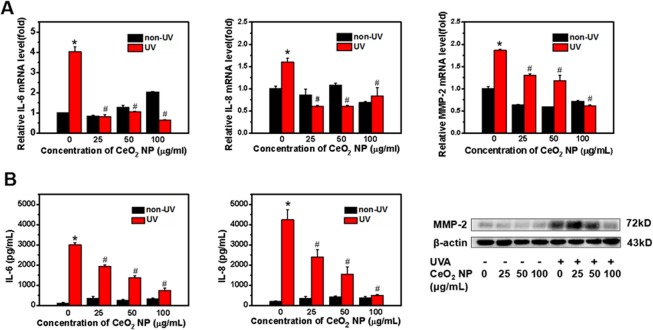
Figure 5.
Biomarker expression in photoaged cells at gene and protein levels. (A) Relative mRNA expression of IL-6, IL-8 and MMP-2 compared with untreated cells. Data are represented as fold-changes. GAPDH was the internal reference gene in RT-PCR. (B) Concentrations of IL-6 and IL-8 in culture supernatants collected after exposure were examined using ELISA kits. Protein expression of MMP-2 after exposure to CeO2 NP or UVA radiation was determined by western blotting. β-Actin was the loading control for western blotting. Data are representative of three separate experiments. Data are the mean ± SD. *p < 0.05, compared with the control group. #p < 0.05, compared with the group treated only with UVA radiation.

