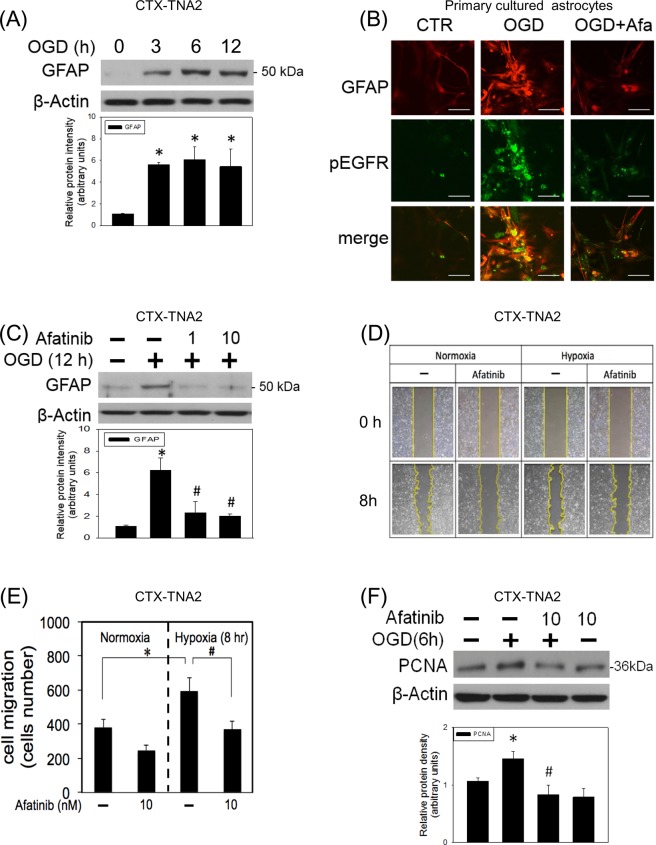
Figure 3.
Afatinib prevented OGD-induced astrocyte activation. (A) CTX-TNA2 cells were exposed to oxygen-glucose deprivation (OGD) for various durations (3, 6, 12 h). Western blot assay was employed to measure GFAP. Each lane contained 40 μg protein for all experiments. Graphs show statistic results of GFAP from relative optical density of bands on the blots. Values are the mean ± S.E.M. (n = 3/group).*P < 0.05 in the OGD group compared with the control by t-test. (B) Representative confocal microscopic data showed co-localization of immunofluorescence of GFAP (Red) and pEGFR (Green). Primary cultured astrocytes were exposed to 12-h OGD. Afatinib (10 nM) was included in the culture medium concomitantly with OGD exposure. Scale bar: 20 μm. (C) CTX-TNA2 cells were exposed to 12-h OGD. Afatinib (1, 10 nM) was included in the culture medium concomitantly with OGD exposure. Graphs show statistic results of GFAP from relative optical density of bands on the blots. Values are the mean ± S.E.M. (n = 3/group). *P < 0.05 in the OGD group compared with the control, #P < 0.05 in OGD plus afatinib compared with OGD alone by Kruskal-Wallis test and followed by Mann-Whitney U test as post-hoc method. (D) CTX-TNA2 cells were incubated with or without afatinib (10 nM) in normoxia and hypoxic (1% O2) chambers for 8 h. The cell migration of CTX-TNA2 cells was studied using a wound-healing assay. Representative microscopic data showed the cells at the identical location 8 h after the initiation of wound. (E) The statistical graph shows the migration quantified by counting the cells that had migrated in the cell-free area using Image J. Values are the mean ± S.E.M. (n = 3/group). (F) CTX-TNA2 cells were exposed to 6-h OGD. Afatinib was included in the culture medium concomitantly with OGD exposure. Graphs show statistic results of PCNA from relative optical density of bands on the blots. Values are the mean ± S.E.M. (n = 3/group). *P < 0.05 in the OGD group compared with the control, #P < 0.05 in OGD plus afatinib compared with OGD alone by Kruskal-Wallis test and followed by Mann-Whitney U test as post-hoc method.

