Figure 6.
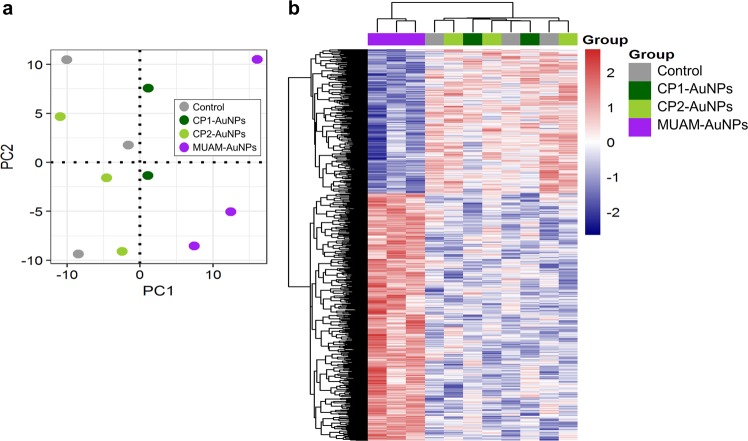
Gene expression profiles of HeLa cells treated with cationic gold nanoparticles (AuNPs) (a) Global gene expression profiles of the cationic AuNPs (MUAM-, CP1-, and CP2-AuNPs) treated cells were analysed by principal component analysis. The MUAM-AuNPs treated cells showed unique gene expression patterns, while the CP1- and CP2-AuNPs treated samples showed the patterns similar to the control. (b) Heat map analysis of gene expression pattern shows hierarchical clustering of 1,156 differentially expressed genes between MUAM-AuNPs treated samples and the group of three other samples. Red and blue colours indicate up- and down-expression levels, respectively.

