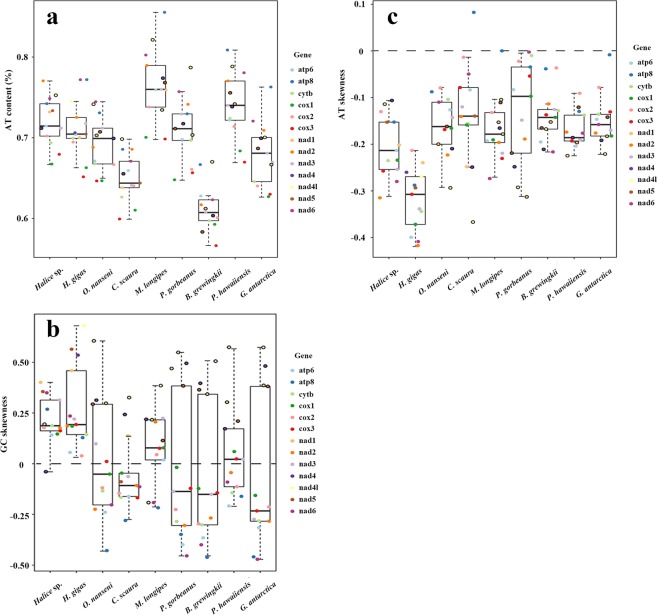
Figure 4.
Mitochondrial nucleotide composition of amphipods from different superfamilies. Box plots showed the AT content (a), GC skewness (b), and AT skewness (c) of 13 PCGs in mitochondrial genomes from nine amphipod species. Each PCG was represented by dots in different colors randomly jittered within the defined box border. The dots for genes encoded on the heavy (or minus) strand were marked by a black circle. Because the H. gigas mitochondrial genome had two contigs, the polarities of its PCGs were not discriminated.

