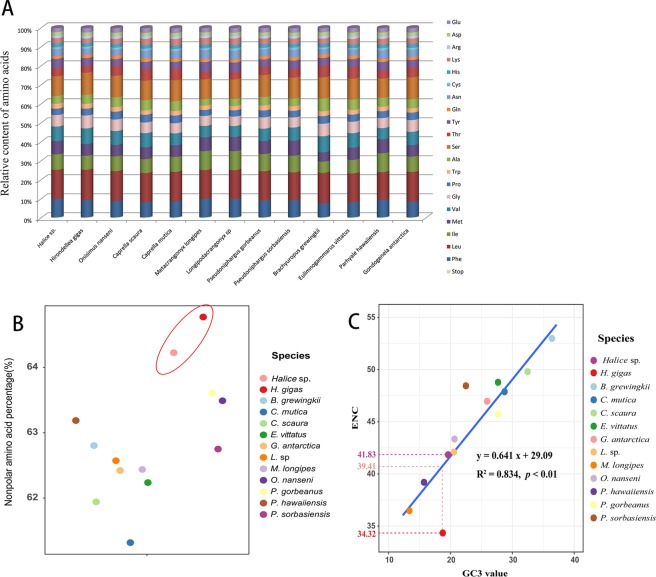
Figure 5.
Statistical data for amino acid contents and ENCs within the mitochondrial PCGs of amphipods from different superfamilies. (A) Relative amino acid contents within the mitochondrial genome of amphipods from different superfamilies. (B) Percentage of nonpolar amino acids in mitochondrial PCGs of different amphipods. The dots representing the two hadal species showed significantly higher values than other dots. (C) The relationship between the effective number of codons (ENC) and the GC content at the third codon position (GC3).

