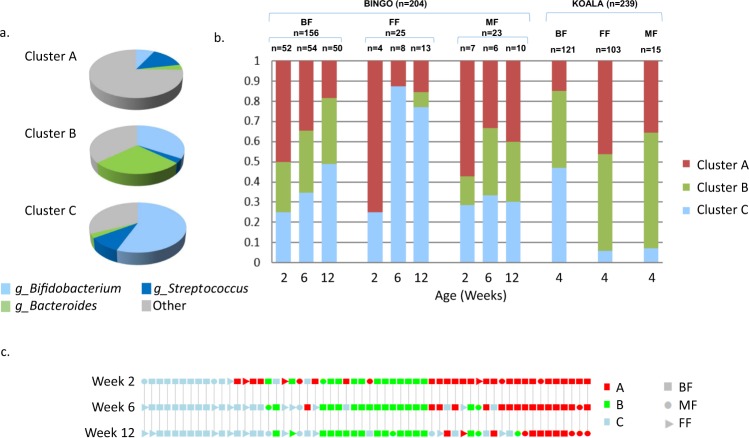
Figure 6.
DMM clustering of samples on the basis of faecal microbiota composition at genus level; (a) Average relative abundance of microbial groups characteristic to individual cluster A, B and C; (b) Fraction of samples from infants receiving different types of feeding (BF, breastfeeding; FF, formula feeding; MF, mixed feeding) within each cluster category; (c) Temporal evolution of cluster assignment for infants in the BINGO study cohort, indicating cluster type (red - cluster A, green - cluster B, blue - cluster C), and type of feeding at each time point (square - BF, circle - MF, triangle - FF).

