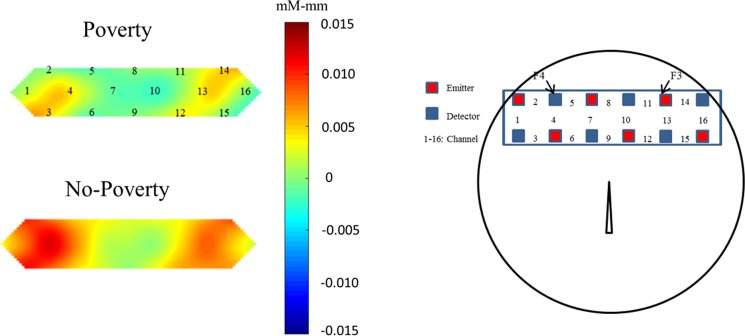
Figure 4.
Distinct neural activation patterns in lateral prefrontal regions of preschool children from the poverty and no-poverty groups. Averaged overall near-infrared spectroscopy data were compared between task and rest phases. Each channel consisted of one emitter optode and one detector optode. The regions of interest were located near F3 and F4 of the 10/20 system, corresponding to channels 2 4 and 5 (right hemisphere) and channels 13 and 14 (left hemisphere), respectively. The numbers (1–16) indicate the channels of the NIRS probe. Low-SES children exhibited hypoactivation in the lateral prefrontal region.

