Fig. 2.
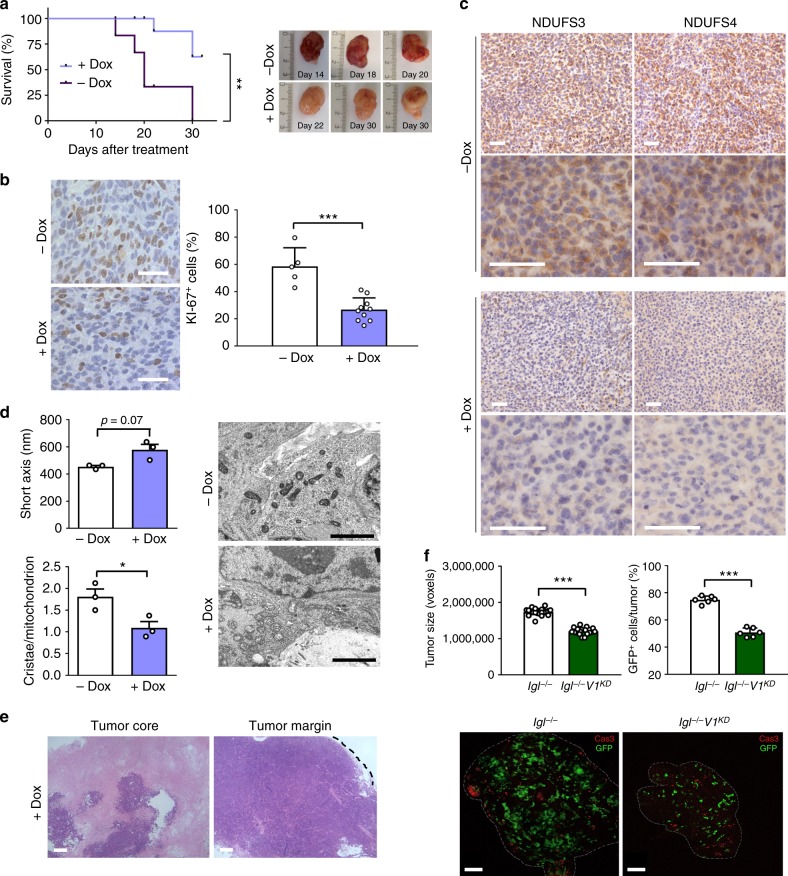
Targeting CI arrests tumor progression and converts carcinomas into oncocytomas. a Kaplan–Meier survival curves of CD-1 nude mice injected with 143B−/−NDUFS3 cells and treated with (n = 7) or without (n = 5) Dox (1 mg mL−1 in drinking water). Survival end-point: xenografts reaching 10% of animal weight. Representative xenografts are shown. b Quantification of cells displaying KI-67 positive nuclei in 143B−/−NDUFS3 tumors treated with (n = 7) or without (n = 5) Dox (1 mg mL−1 in drinking water) (df = 13, t = 5.539). Representative image of KI-67 immunohistochemistry staining is shown. Scale bars: 50 µm. Data are mean + s.e.m. c Immunohistochemistry staining of CI subunits in xenografts treated with or without Dox (1 mg mL−1 in drinking water). Representative images are shown. Scale bars: 50 µm. d Short mitochondrial axis width (n = 3, df = 4, t = 2.4) and cristae number (n = 3, df = 4, t = 3.1) evaluation, with representative electron micrographs of xenografts treated with or without Dox (1 mg mL−1 in drinking water). Scale bars: 2 µm. Data are mean + s.e.m. e Hematoxylin/eosin staining of 143B−/−NDUFS3 tumors treated with Dox. Tumor margin is indicated by the dashed line. Representative images are shown. Scale bars: 100 µm. f Immunofluorescence for caspase 3 (Cas3) of CI-competent (lgl−/−) and deficient (lgl−/−V1KD) epithelial tumors (GFP+) of the fly. Dashed lines delineate tumor margin. Scale bars: 80 µm. Tumor size (n = 25, df = 48, t = 13.2) and the average number of GFP+ cells (n = 6, df = 10, t = 13.8) were evaluated. Data are mean + s.e.m. In each panel, statistical significance is specified with asterisks (*p < 0.05, **p < 0.01, ***p < 0.001)

