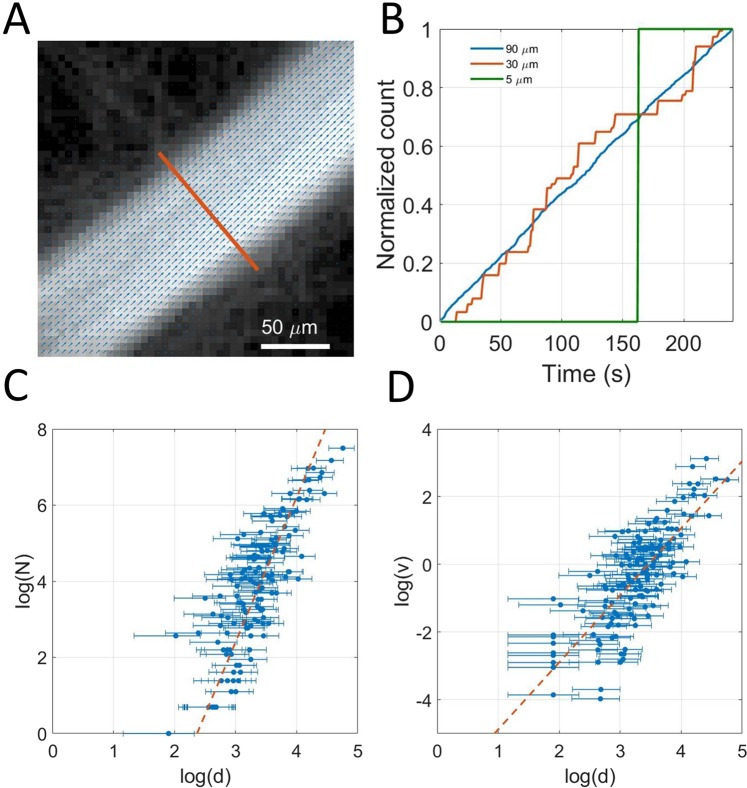
Figure 4.
Local approach using 150 individualized vessels. (A) Example of a selected vessel’s section superimposed on density image with velocity field (B). Example of time dependency of microbubbles count in three vessels of 80 μm, 20 μm and 5 μm. (C) Dependency of the bubble rate with vessel’s diameter measured on a 150 vessels sample, fit with p1 = 3.7, p2 = −8.2, R2 = 0.70. (D) Dependency of maximum velocity with vessel’s diameter measured on a 150 vessels sample fit with p1 = 1.9, p2 = −6, R2 = 0.60.

