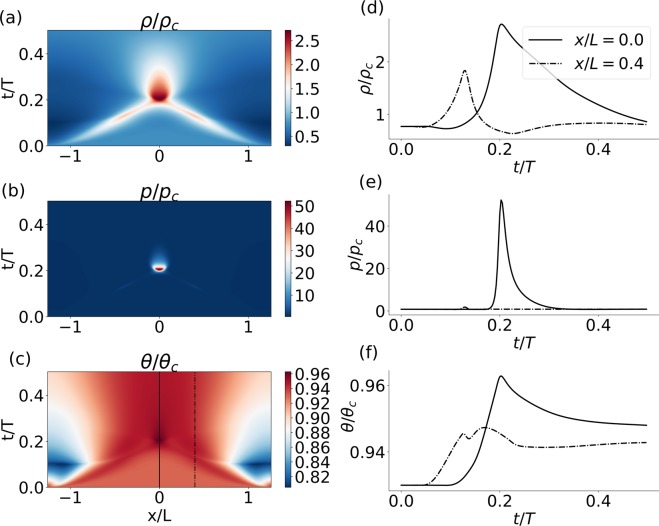
Figure 5.
Collision between two pulses as appeared in the (a) density, (b) pressure and (c) temperature fields. x- and y-axis represent space and time, respectively. A local description of the (d) density, (e) pressure and (f) temperature is plotted as a function of time at the collision point (x/L = 0, solid line) and at some distance away from it (x/L = 0.4, dashed-dotted line). The location of these solutions in space is marked in (c) by solid and dashed-dotted line, respectively. Fluid initial density was = 0.77. Excitation was conducted at = ±0.4 π. Numerical calculation was performed with 8192 grid points, and the x-domain was [−0.4π, 0.4π]. Other parameters are similar to those given in caption of Fig. 2.

