Fig. 4.
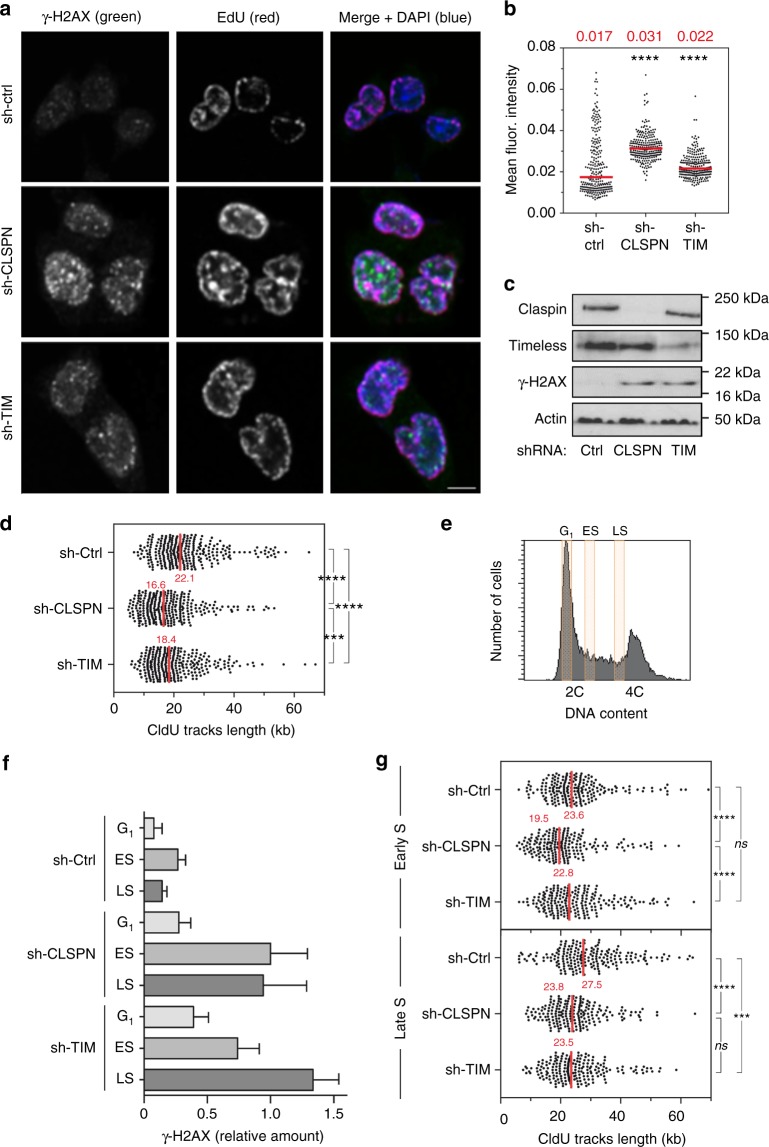
Reduction of Claspin and Timeless levels in HCT116 cells increases spontaneous replication stress and slows down fork progression. a Immunofluorescence analysis of spontaneous γ-H2AX foci in EdU-positive sh-Ctrl, sh-CLSPN and sh-TIM HCT116 cells. Cells were pulse labeled for 10 min with EdU prior to analysis. Representative images are shown. Scale bar, 5 µm. b Quantification of γ-H2AX signal intensity in EdU-positive sh-Ctrl, sh-CLSPN, and sh-TIM cells. c Western blot analysis of H2AX phosphorylation on Ser139 in untreated sh-Ctrl, sh-CLSPN, and sh-TIM HCT116 cells. d DNA combing analysis of replication fork progression in sh-Ctrl, sh-CLSPN, and sh-TIM HCT116 cells. Asynchronous cultures were pulse labeled for 10 min with IdU and 20 min with CldU. DNA fibers were extracted, stretched on silanized coverslips and analyzed by immunofluorescence using antibodies against IdU, CldU, and ssDNA. The length of CldU tracks was determined for three independent experiments. Median lengths are indicated in red. ****p < 0.0001, ***p < 0.001. Mann–Whitney rank sum test. e Exponentially growing sh-Ctrl, sh-CLSPN, and sh-TIM HCT116 cells were labeled for 10 min with IdU, 20 min with CldU and were sorted by FACS according to their DNA content. G1, early S phase (ES), and late S phase (LS) cells were collected for further analysis. f Western blot analysis of γ-H2AX levels in sh-Ctrl, sh-CLSPN, and sh-TIM HCT116 cells collected in G1, early S phase (ES), and late S phase (LS). Relative levels calculated for three independent experiments after normalization to tubulin are shown. g DNA combing analysis of replication fork speed in sh-Ctrl, sh-CLSPN, and sh-TIM HCT116 cells collected in early S and late S. Median lengths of CldU tracks were determined for three independent experiments and indicated in red. ****p < 0.0001, ***p < 0.001, ns nonsignificant. Mann–Whitney rank sum test

