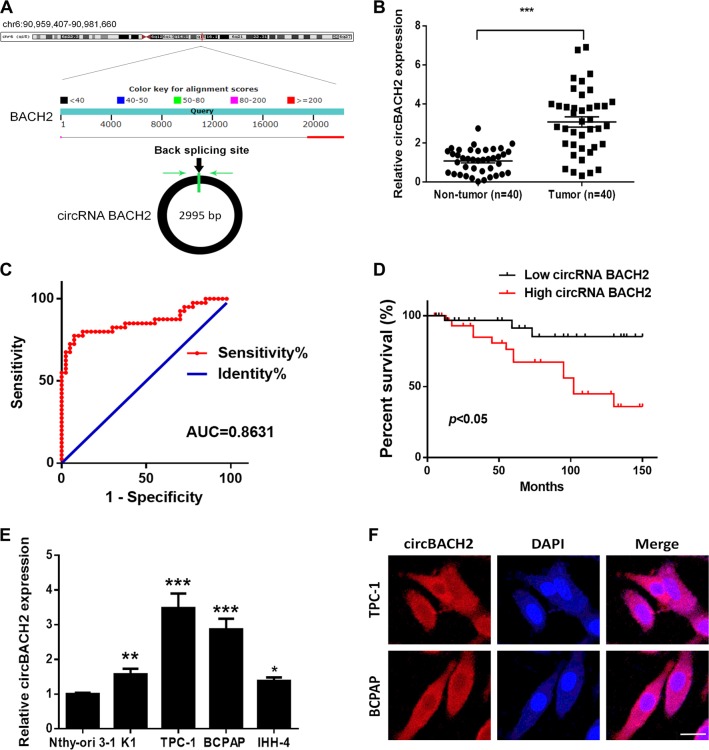
Fig. 1. CircBACH2 is highly expressed in PTC tissues and PTC cell lines.
a The genomic loci of the BACH2 gene and circBACH2. Green arrow indicates back-splicing. b CircBACH2 levels were detected by RT-PCR in PTC tissues (n = 40) compared with paratumor tissue samples (n = 40). c The area under the ROC curve was 0.8631 (95% CI = 0.7774–0.9489, P < 0.0001). d Kaplan–Meier survival curve of patients with low and high expression of circBACH2. e CircBACH2 expression levels in PTC cell lines and human thyroid follicular epithelial cells (n = 3) were analyzed by RT-PCR. f Fluorescence in situ hybridization assay was conducted to determine the subcellular localization of circBACH2. Scale bar, 20 μm. Data indicate the mean ± SD, n = 3. *P < 0.05, **P < 0.01, ***P < 0.001 vs. control

