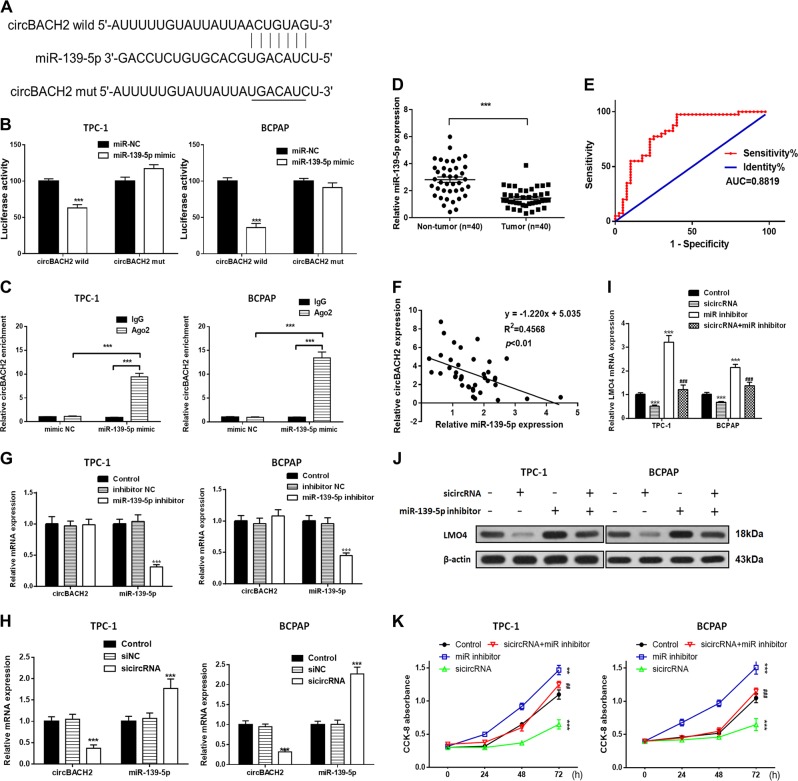
Fig. 2. Silencing of circBACH2 inhibits cell proliferation in TPC-1 and BCPAP cells.
a Wild-type (wt) and mutated (mut) circBACH2 was transfected into TPC-1 and BCPAP cells with or without synthetic miR-139-5p mimics. b Relative luciferase activity was detected by luciferase assays in TPC-1 and BCPAP cells. c Anti-AGO2 RIP was performed in TPC-1 and BCPAP cells transfected with miR-139-5p mimics or miR-NC, followed by RT-PCR to detect circBACH2. d miR-139-5p levels were detected by RT-PCR in PTC tissues (n = 40) compared with paratumor tissue samples (n = 40). e The area under the ROC curve was 0.8819 (95% CI = 0.8254–0.9384, P < 0.0001). f The correlation between miR-139-5p and circBACH2 expression in PTC tissues was determined by Spearman’s correlation analysis. g–i The expression of miR-139-5p and circBACH2 was determined by RT-PCR in TPC-1 and BCPAP cells, in which sicircRNA, miR-139-5p inhibitor, or both, were suppressed. j The expression of LMO4 was determined by RT-PCR and western blotting in TPC-1 and BCPAP cells in which sicircRNA, miR-139-5p inhibitor, or both, were suppressed. k Cell viability was determined by a CCK-8 assay in TPC-1 and BCPAP cells. Data indicate the mean±SD, n = 3. *P < 0.05, **P < 0.01, ***P < 0.001 vs. control and ##P < 0.01, ###P < 0.001 vs. sicircRNA

