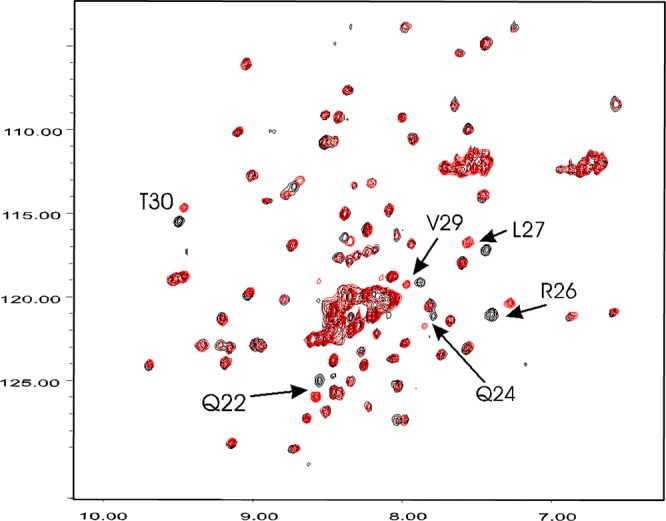
Figure 2.

Overlay of the 15N HSQC spectra (at 500 MHz) of free F2 and FVa heavy chain-titrated F2. The HSQC spectra were recorded in 90% H2O and 10% D2O with 50 mM sodium phosphate at pH 7.0 and at 35 °C. The protein concentrations were 0.3 mM for F2 and 0.03 mM for the FVa heavy chain (FVa-HC). HSQC peaks of F2 most shifted by FVa are labelled by the assigned F2 residues. The arrows point to the center of resonance displacement between the free F2 (black) and F2 complexed with FVa (red). Peak displacements of the affected F2 residues decreased gradually (not shown) as the FVa-HC concentration varied between 0.03 mM and 0.01 mM.
