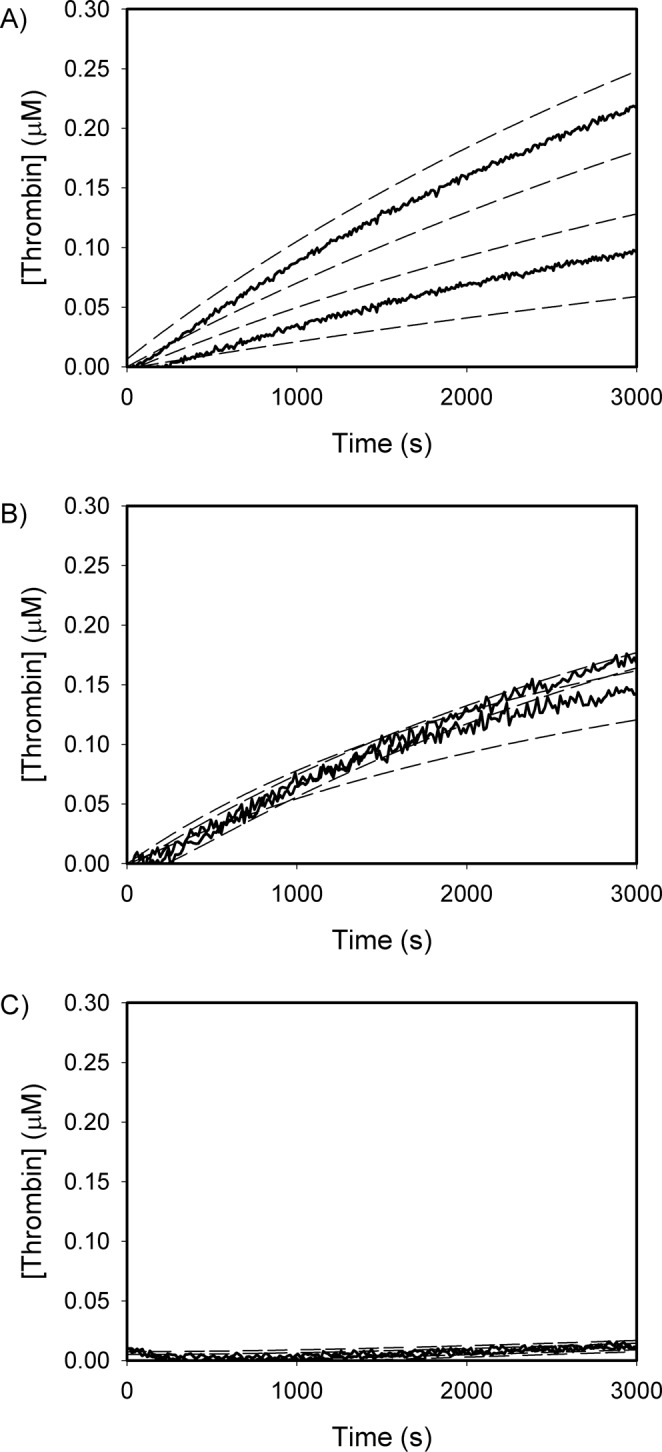
Figure 4.

Thrombin generation profile of wild-type prothrombin and PT6 (1 μM) activation by (A) FXa/FVa, (B) FXa/PCPS, or (C) FXa alone, measured by FRET analysis using DAPA. Reaction mixtures for each set of conditions were as follows: (A) FXa (5 nM) and FVa (20 nM) (FXa/FVa), (B) FXa (5 nM) and PCPS (50 μM) (FXa/PCPS), and (C) FXa alone (5 nM). Under all conditions, experiments were initiated with the addition of FXa in HBST buffer with CaCl2 (5 mM) and DAPA (10 μM). Fluorescence was measured by a SpectraMax M2 fluorescent plate reader, with an excitation wavelength of 280 nm, emission wavelength of 545 nm and an emission cutoff at 530 nm at 20 s intervals.
