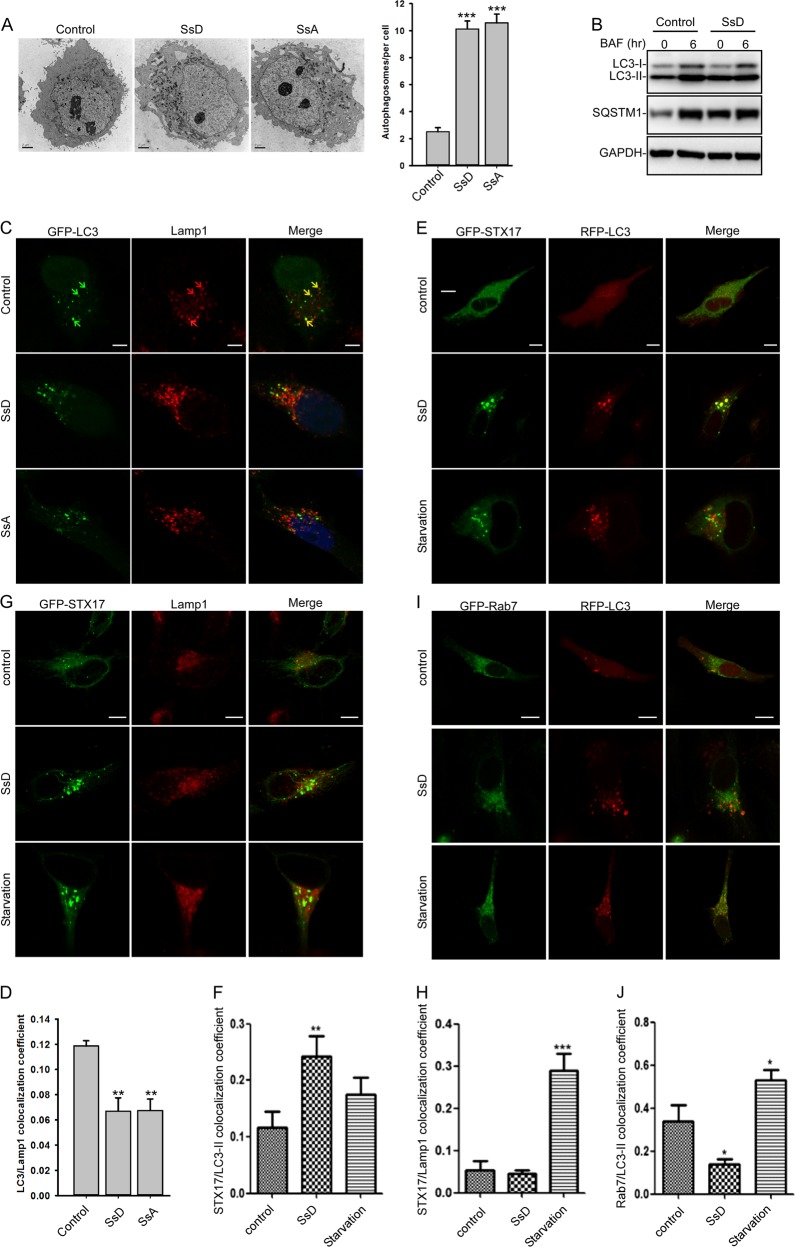
Fig. 2.
SsD induces the accumulation of autophagosomes. a SsD (15 μM) and SsA (30 μM) induced the accumulation of autophagic vacuoles as shown in the electron micrographs. Quantification of autophagosomes per cell is presented as the mean ± S.E., n = ~20 to 40 cells. The asterisks (*) symbols indicate p < 0.05 by t test analysis. b BAF (100 nM) treatment for 6 h failed to further induce the accumulation of either LC3-II or SQSTM1 in control or SsD (15 μM)-treated HeLa cells. c, d HeLa cells were transfected with GFP-LC3 and treated with or without SsD (15 μM) or SsA (30 μM) before Lamp1 immunostaining and confocal imaging (c). The quantification of LC3-II/Lamp1 co-localization is presented as the mean ± S.E., n = ~80 to 100 cells of 3 independent experiments (d). e, f HeLa cells were transfected with GFP-STX17 and RFP-LC3 and treated with or without SsD (15 μM) or underwent starvation followed by confocal imaging (e). The quantification of LC3-II/STX17 co-localization is expressed as the mean ± S.E., n = 3 (totally 15–30 cells) (f). g, h HeLa cells were transfected with GFP-STX17 and treated with or without SsD (15 μM) or underwent starvation prior to Lamp1 immunostaining and confocal imaging (g). The quantification of STX17/Lamp1 co-localization is expressed as the mean ± S.E., n = 3 (totally 15–30 cells) (h). i, j HeLa cells were transfected with GFP-RAB7 and RFP-LC3 and treated with or without SsD (15 μM) or underwent starvation prior to confocal imaging (i). The quantification of RAB7/LC3-II co-localization is expressed as the mean ± S.E., n = 3 (totally 15–30 cells) (j). Scale bar = 10 μm. Differences between control group and treatment groups were analyzed by one-way ANOVA

