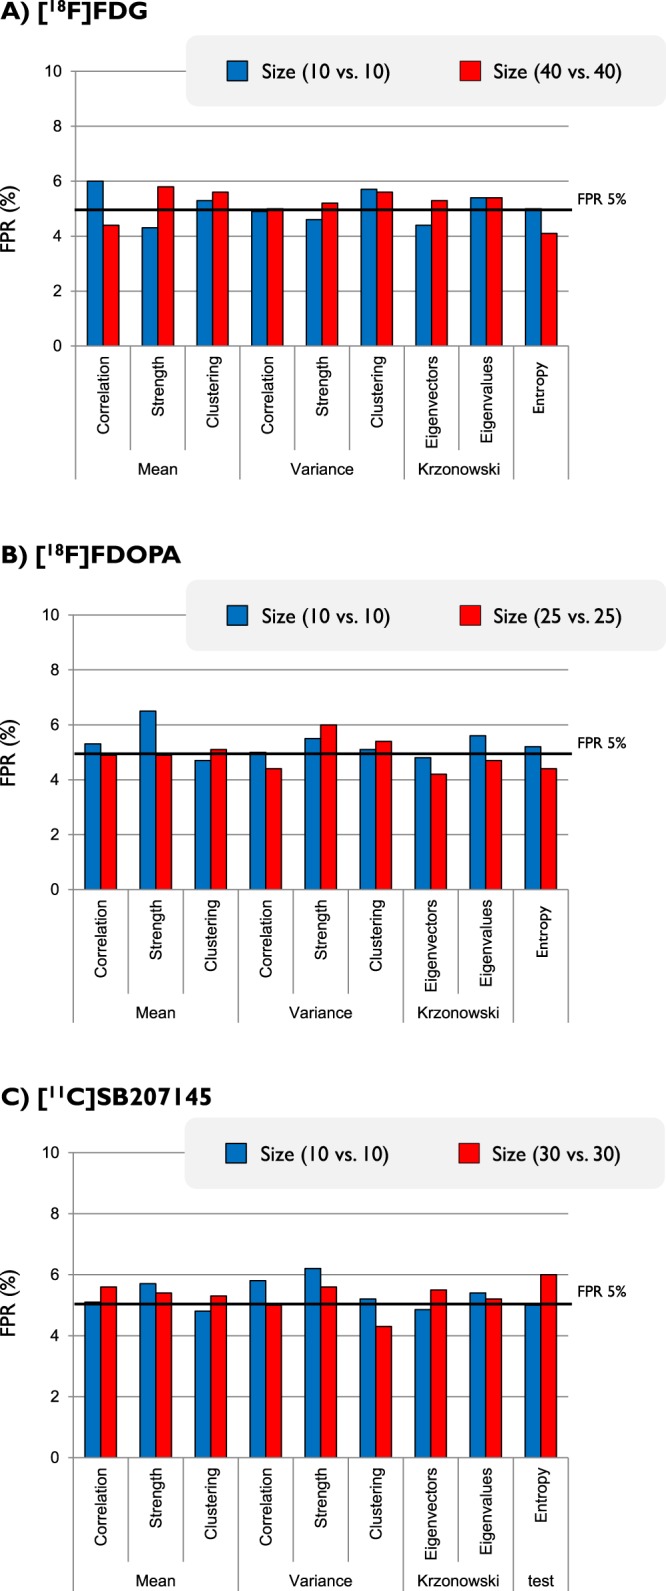
Figure 3.

Test sensitivity to population size. False positive rates (FPRs) as obtained for different metrics and different tracers are reported as function of the full dataset (red bars) and the reduced one (10 subjects per groups, blue bars). All the results refer to permutation analysis. Paired t-test between full dataset FPRs and reduced dataset FPRs does not show any statistical difference in any of the tracers (p-value: 0.78 for [18F]FDG, 0.15 for [18F]FDOPA and 0.94 for [11C]SB207145).
