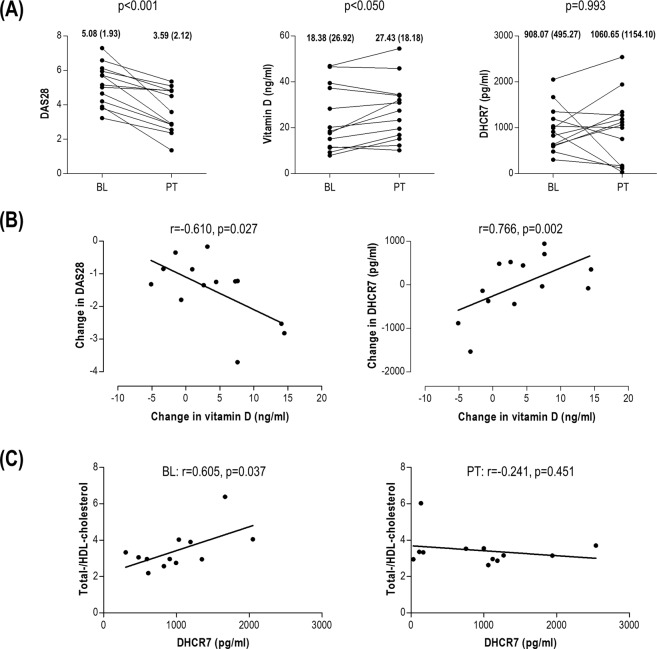
Figure 2.
Vitamin D, DHCR7 and lipid profiles upon TNFa-blockade in RA. (A) Changes in DAS28, vitamin D and DHCR7 in patients following TNFa-blockade therapy for 3 months. Values before the initiation of the treatment (baseline, BL) and after treatment (post-treatment, PT) were evaluated by Wilcoxon paired tests. BL and PT medians (interquartile range) for each of the variables analyzed was included at the top of each graph. (B) Associations between the change (PT minus BL) in serum vitamin D levels and DAS28 as well as in DHCR7 serum levels. (C) Correlation between the total-/HDL-cholesterol ratio and DHCR7 serum levels before (BL) and after (PT) treatment. Correlations were evaluated by Spearman rank’s tests.

