Fig. 3.
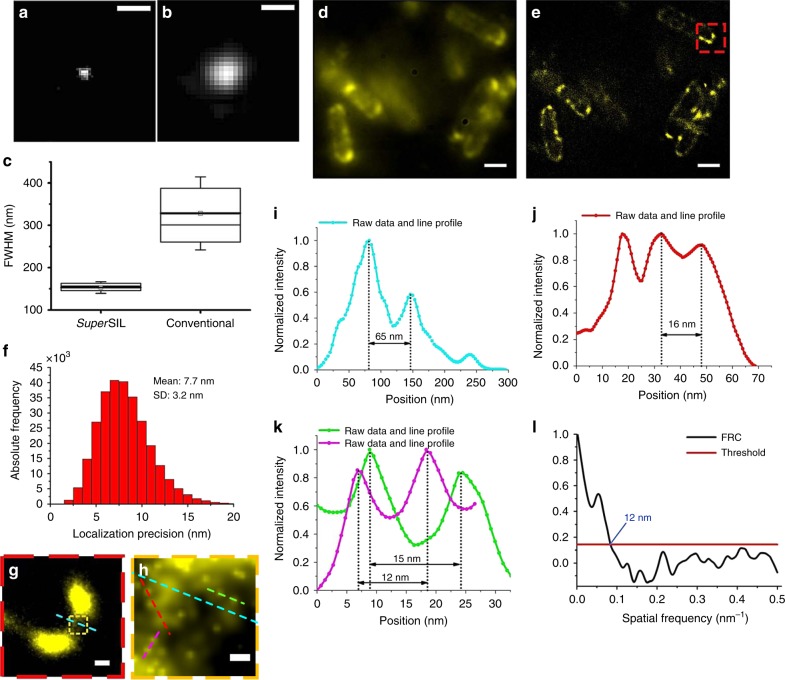
SuperSIL resolution characterization and imaging of E. coli cells under cryogenic conditions. Representative images of sub-diffraction limited objects from a the superSIL microscope and b the specialist system. Scale bar: 0.5 µm. c Box charts of FWHM of the PSFs for the superSIL and specialist systems showing the 25th and 75th percentiles of the data points. The thick line with a square at the center shows the mean value; the thin line in the box shows 50th percentile. The mean of FWHM was 153 ± 14 and 328 ± 86 nm in the case of superSIL and 0.9 NA objective, respectively. The whiskers show the standard deviation. d ATP-binding cassette (ABC) transporter protein PH1735 fused with EGFP in E. coli cells imaged in wide-field superSIL microscopy and e superSIL STORM. f Localization precision histogram from the image in e. g The enlarged image of the region of the cell indicated by the red dashed border box in e. h The enlarged image of the small region in the cell indicated by the orange dashed border box in g. i Line profile of the cross-section of two PH1735 protein clusters indicated by the cyan dashed lines in h. j Line profile of the cross-section of two PH1735 protein clusters closer to each other indicated by the red dashed line in h. k Line profiles of the cross-section of two adjacent single molecules (magenta and green) indicated by the magenta and green dashed lines in h. l FRC curve revealing the 12 nm resolution in the region shown in h. Scale bars: 1 μm (d, e), 100 nm (g) and 20 nm (h)

