Figure 3.
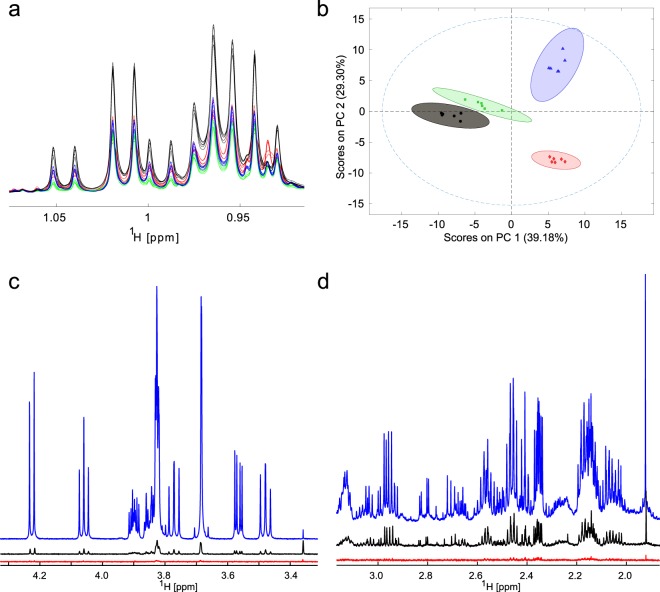
Increasing the power of NMR metabolomics analysis by increasing sample reproducibility, and by enhancing sensitivity with modern probe technology. (a) Spectra of four hematological cell lines (black: U266 and green: UM3, both myeloma cell lines, blue: Sudhl6 diffuse large B-cell lymphoma, red: Glor Burkitt’s lymphoma cell line) with 6 replicates per cell line to illustrate the required level of reproducibility. (b) Principal Component Analysis plot of spectra shown in (a) with 95% confidence intervals showing a clear separation between classes of cells and excellent clustering within the individual cell lines. (c,d) Comparison of 1D spectra obtained from two equal mass samples, either sucrose (c) or hepatocarcinoma cell line (HuH7) extracts (d) using a 1.7 mm micro-cryoprobe (blue), a 5 mm cryoprobe (black) and a 5 mm room temperature (RT) probe (red). These panels illustrate a factor 5–7 sensitivity gain from the RT to the cryoprobe, and another factor of 5–7 for the micro-cryoprobe. Overall the gain for equal sample masses from the RT to the micro-cryoprobe can be up to 40 fold.

