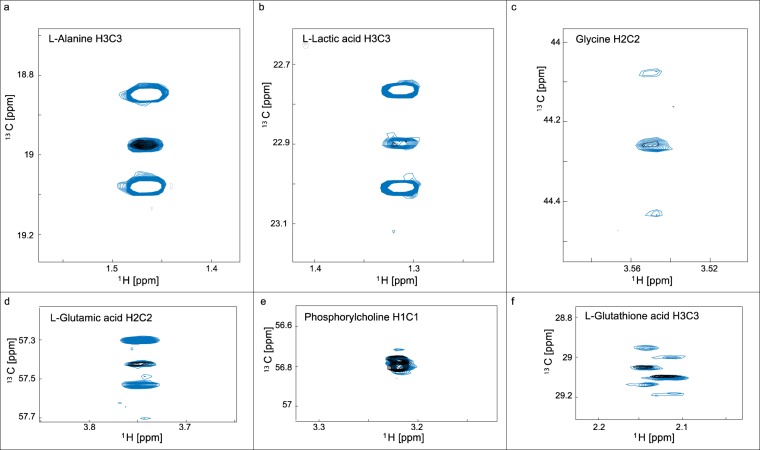
Figure 8.
Feasibility of tracer-based analysis from donor liver samples. Overlaid sections from 1H-13C -HSQC of polar extracts from hepatocytes isolated from a donor liver sample. Black and blue resonances arise from samples exposed for 4.5h to media containing unlabeled glucose and [U-13C]glucose, respectively. Panels show the spectral regions for L-alanine C3 (a), L-lactic acid C3 (b), L-glycine C2 (c), L-glutamic acid C3 (d), phosphorylcholine C1 (e) and L-glutathione C3 (f). Phosphorylcholine was not enriched and is included as a scaling reference but the other metabolites were enriched by [U-13C]Glucose.

